


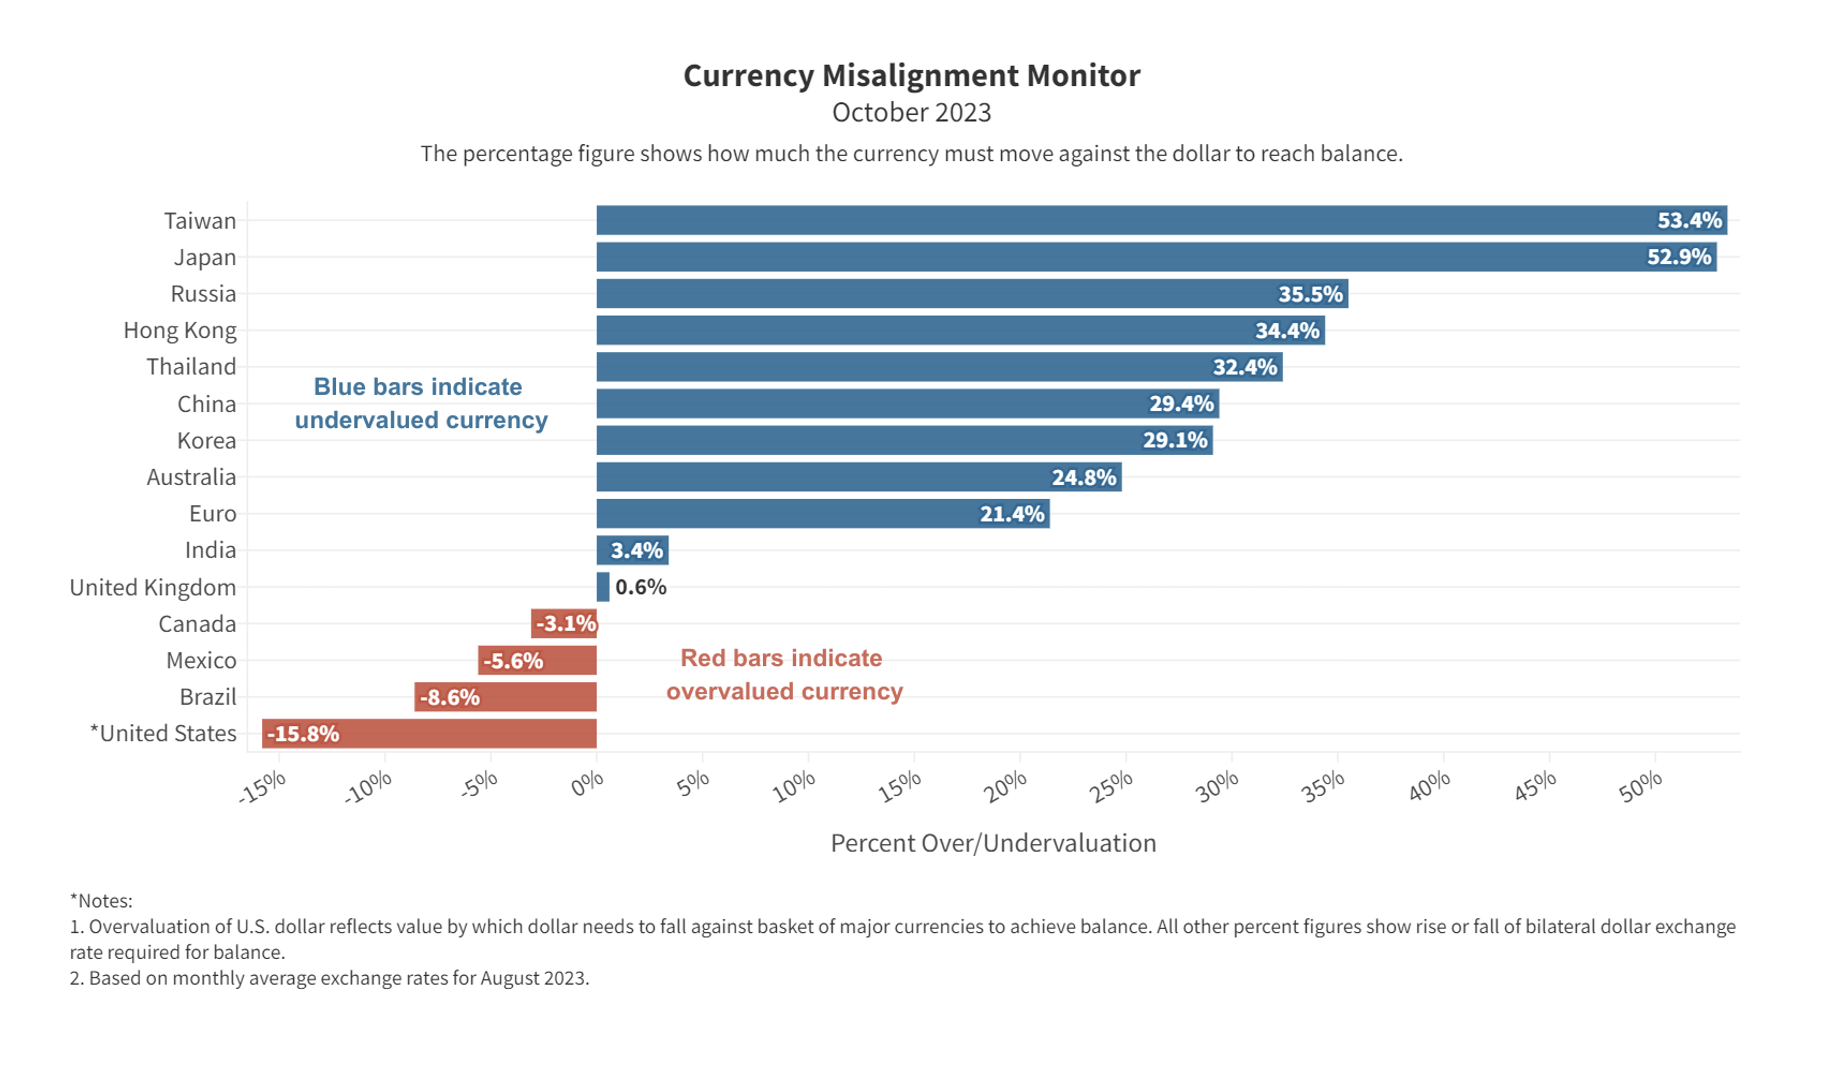
- Monthly index tracks currency misalignment based on latest market rates
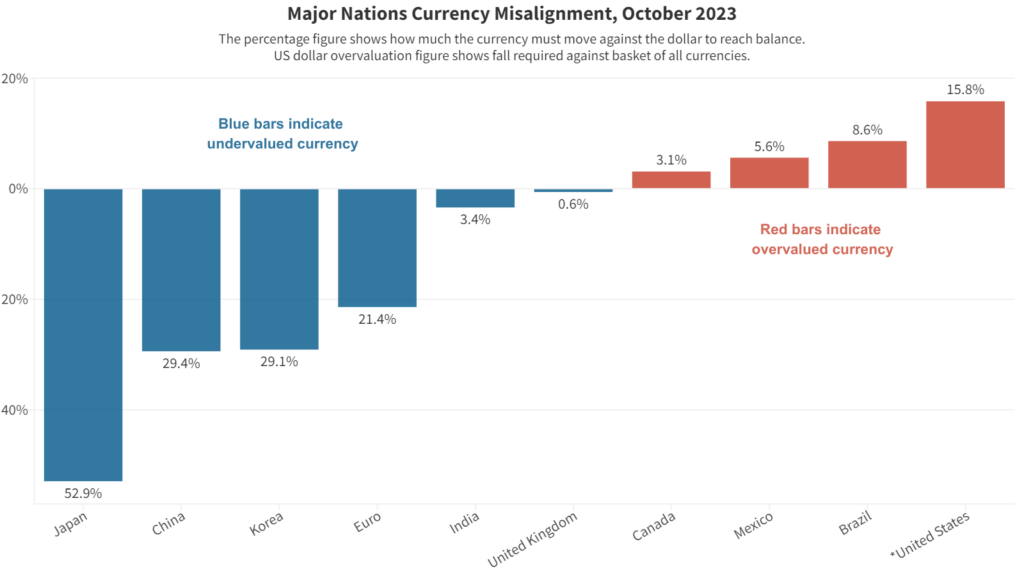
- Dollar overvaluation jumped again, to 15.8% on firmer U.S. interest rates
- Japanese yen undervaluation worsened to 52.9%
- Chinese yuan undervaluation worsened to 29.1% as China let currency slide further
- CMM is a partnership between the Coalition for a Prosperous America (CPA) and the Blue Collar Dollar Institute (BCDI).
The October Currency Misalignment Monitor – a monthly index that tracks currency misalignment among major economies – shows that dollar overvaluation rose yet again last month, reaching 15.8% against the basket of 33 other currencies included in our model.
Unsurprisingly, persistent buying of dollar assets by international investors is depressing the Japanese yen, resulting in an eye-popping 52.9% undervaluation against the dollar. China’s currency is 29.1% undervalued, as investor sentiment against the Chinese currency is reinforced by the Chinese central bank’s apparent desire to see the currency fall as China struggles with multifaceted domestic economic challenges.
These are huge challenges for the U.S. economy as well as businesses struggling against imports here at home or struggling to win export markets. The overvalued dollar is an unwarranted boost for foreign producers and a handicap for U.S. producers. The U.S. trade deficit is running at an annual rate of over $800 billion (the deficit is running at over $1 trillion the goods side, offset by a small surplus on services trade). The latest sharp increase in dollar value that began in July will make the plight of domestic producers even worse in the coming months and next year.
The main driver of the most recent rise in the dollar’s exchange value was the outcome of the Federal Reserve Open Market Committee’s Sept. 20th meeting, after which chairman Powell said that the Fed is “strongly committed” to returning inflation to the 2% level. International investors interpreted that to mean that U.S. interest rates will be “higher for longer,” to quote the catchphrase now used frequently by traders. High U.S. interest rates attract international capital to dollar bank accounts and securities, bidding up the value of the dollar.
Our data is based on the average of daily exchange rate values for August, the latest available inflation-adjusted (“real”) exchange rate data available from the Bank for International Settlements (BIS). Meanwhile, September has seen further increases in the value of the dollar, especially against European currencies. Europe has seen more weak economic data, leading to fears that European central banks may cut interest rates. That fear has weakened the euro and the pound sterling further in September. Next month’s CMM is likely to see dollar overvaluation rise still further.
Our model uses BIS and International Monetary Fund data and forecasts to estimate the current account surpluses and deficits of 34 major nations five years from now (2028), and what movement would be required in each exchange rate now to bring those current accounts into balance in five years. In a deficit nation like the U.S., a lower dollar boosts exports and reduces imports, allowing the current account deficit to fall. In a surplus nation like China, the reverse process would occur: a higher yuan would reduce exports and increase imports, wiping out the surplus within five years.
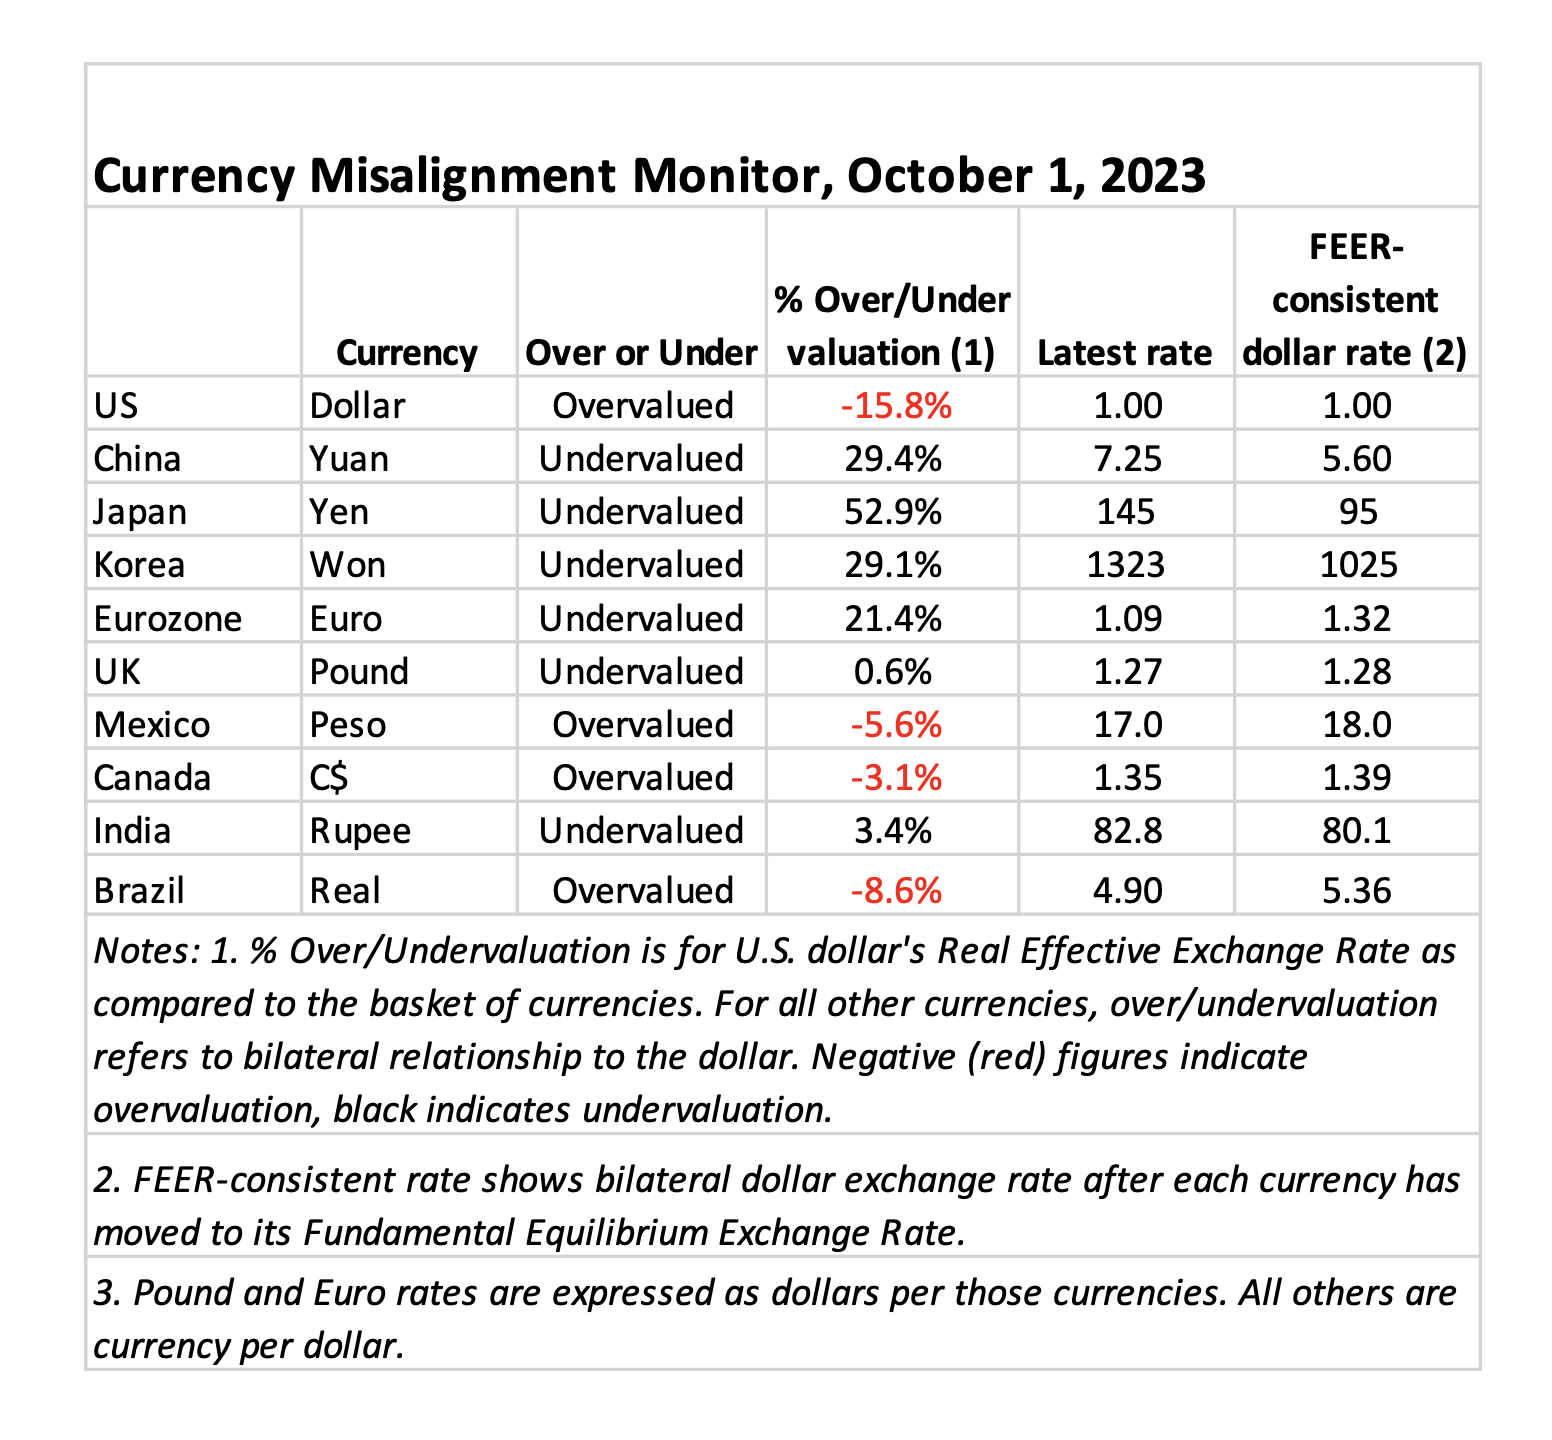
Table 1. Currency valuations from the Currency Misalignment Monitor, October 2023
The CMM is based on a mathematical model in which 34 major currencies all move simultaneously to bring global current accounts into balance over a five-year time horizon. If the dollar had to move on its own, the dollar would need to move by approximately twice as much, or around 25%, to achieve fair value for the U.S. economy, i.e. a value that eliminated the current account deficit. The current account deficit is dominated by the trade deficit, but also includes some other financial flows into and out of the U.S.
METHODOLOGY
The Currency Misalignment Monitor is based on pioneering work done by William Cline at the Peterson Institute for International Economics. The Cline model, also known as SMIM for Symmetric Matrix Inversion Method, uses IMF forecasts for current account balances for 34 nations to derive a simultaneous solution for all exchange rates that will minimize national current account balances, including surpluses and deficits. The CMM uses this methodology. However, the Cline version sets a target of plus or minus 3% of GDP for each nation’s current account. We believe this is too flexible for a properly functioning global trading system. Our model sets a target of 0% current account balance for each nation. Most nations do not achieve 0% in year five, but the model seeks to get them as close to zero as possible and in so doing gives us a realistic sense of each currency’s over or undervaluation.
Note also that this methodology is dependent on IMF forecasts, which currently run from 2023 data out to 2028. The IMF has a history of optimism, including for example expectations that the U.S. current account deficit and the China surplus will both contract over time. If those forecasts turn out to be over-optimistic, then the misalignment estimates in the Monitor could well be understated. Nevertheless the Cline SMIM model is an innovative method for incorporating a large amount of global data into a single model.
The Currency Misalignment Monitor (CMM) is published in partnership between the Coalition for a Prosperous America (CPA) and the Blue Collar Dollar Institute (BCDI).


