


KEY POINTS
- The 2023 Q4 DMSI increased on both a quarterly and annual basis
- The DMSI rose across most manufacturing sub-sectors, but especially for furniture, wood products, and primary metals
- The increase is due to a leveling off of imports from the record post-COVID year of 2022
- Overall DMSI down 9.5% since 2002, equivalent to an annual loss of $790 billion in domestic market share
- 2023 manufacturing trade deficit remains over $1 trillion
- Motor vehicles now the manufacturing sub-sector with the largest trade deficit
The CPA Domestic Market Share Index (DMSI) rose slightly for both Q4 2023 and the full year last year. The U.S. trade deficit in manufactured goods came in at an alarmingly high $1.07 trillion last year. One quarter of that deficit was accounted for by the motor vehicles sub-sector. The DMSI for total manufacturing and most sub-sectors are below the corresponding 2019 figures, indicating that U.S. producers have lost share to imports compared with pre-COVID levels.
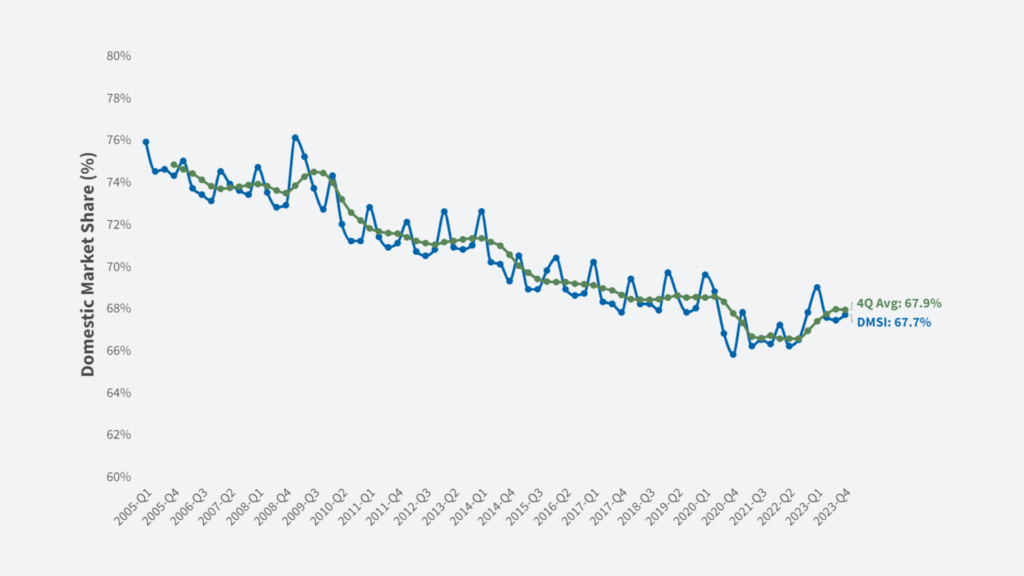
The final quarterly DMSI for 2023 was 67.8, indicating that 67.8% of U.S. manufacturing demand was met by domestic production. The remaining 32.2%, was met by imports. The DMSI is the only regularly published indicator tracking the share of U.S. manufacturing demand that is met by domestic production. It is based entirely on U.S. government data.
The DMSI has fallen a total of 9.5% since 2002. The decline in the DMSI is equivalent to $789.5 billion in annual lost domestic manufacturing market share. This annual dollar value lost is larger than the total 2023 U.S. manufacturing exports to Canada, Mexico, China, and Germany combined.
Figure 1: Domestic Market Share Index (DMSI) (2005-2023)
Source: U.S. Bureau of Economic Analysis, U.S. Census; CPA Calculations
Note: Blue line reflects quarterly data. Green line reflects four-quarter moving average.
The Q4 2023 DMSI index was up 1.1% compared to 2022’s final quarter. However, the increase in Q4 was largely due to a dip in imports, rather than a substantial increase in U.S. manufacturing output. 2022 remains the highest year on record for total U.S. imports, and that is also true for manufacturing goods imports. Total U.S. manufacturing output only increased by 0.6% in 2023, while total manufacturing imports dropped by 4.3%.
2022 was an exceptionally high import year due to a variety of factors. These include continuing economic recovery after the COVID crisis, a stimulus-induced overheating of the economy, as well as fluctuations and volatility in inventory and supply chains readjusting from COVID lockdowns. Import levels in 2023 are moving closer to a post-COVID normal and the 2023 DMSI reflects that.
Domestic Share Losses and Gains by Manufacturing Sub-Sector
Nearly all manufacturing sub-sectors saw an increase in their DMSI. The industries with the largest increase in their DMSI in 2023 were Primary Metals (up 4.6%), Wood Products (up 4.8%), and Furniture and Related Products (up 5%). These industries all experienced a decrease in gross domestic output, but an even larger decrease in imports.
Computer and Electronic Products also saw its DMSI increase, up 3.1% in 2023. However, this remains among the sub-sectors with the lowest total DMSI at 26.2% (meaning about 74% of computer and electronic products purchased in the U.S. are imported).
Figure 2: DMSI Change by Sub-Sector (2023)

Source: U.S. Bureau of Economic Analysis, U.S. Census; CPA Calculations
The manufacturing sub-sector with the largest decrease in its DMSI was Motor vehicles, bodies and trailers, and parts. This sub-sector saw a 1.8% decline in its DMSI in 2023 (reaching 61.8%). This sub-sector did experience an increase in gross output, but this was outpaced by the rise in imports. The only other sector where the DMSI decreased was Petroleum and Coal Products (down 0.2%).
The largest manufacturing sub-sector by total output (Food and Beverage and Tobacco Products) remained largely consistent. The sub-sector experienced a 0.4% rise in its DMSI, ending 2023 with a 88.4% DMSI.
Figure 3: DMSI by Manufacturing Sub-Sector (2023)
Source: U.S. Bureau of Economic Analysis, U.S. Census; CPA Calculations
2023 Trade Deficit in Manufactured Goods at -$1.07 trillion
The 2023 U.S. total trade deficit in manufacturing goods remains alarmingly high. For 2023 as a whole, the manufacturing trade deficit reached, -$1.07 trillion. Furthermore, all but three manufacturing sub-sectors continue to run trade deficits. Nonetheless, the overall deficit is a slight improvement from 2022. In total, the manufacturing trade deficit shrank by $119.4 billion in 2023.
The Motor Vehicles, Bodies and Trailers, and Parts sub-sector now has the largest trade deficit of all sub-sectors after its trade balance fell by $40.6 billion in 2023, leaving the sub-sector with a $256.1 billion total trade deficit in 2023. This decline is also reflected by the fall in its DMSI.
The sub-sector with the largest trade surplus is Other Transportation Equipment (where large civil aircraft sales from Boeing are the most prominent factor). In 2023, this sub-sector experienced a $17 billion increase in its trade balance, reaching a total trade surplus of $67.2 billion in 2023.
Figure 4: Trade Balance by Manufacturing Sub-Sector (2023)
Source: U.S. Bureau of Economic Analysis, U.S. Census; CPA Calculations
Methodology
The CPA Domestic Market Share Index (DMSI) measures the success of U.S. manufacturing producers in the U.S. market. Over the past two decades, imports have gained a larger share in the U.S. market, leading to millions of lost jobs and industrial decline in many regions and many sectors.
The DMSI is based on the value of production, imports, and exports in U.S. manufactured goods. It is calculated entirely from U.S. government data as the inverse of the import share:
DMSI =100*(1-(imports/(output+imports-exports)).
Changes in the reported annual and quarterly DMSI reflect revisions in government data. For more detailed information on the DMSI including downloadable data, please contact arechenberg@prosperousamerica.org.
DMSI Report Archive


