


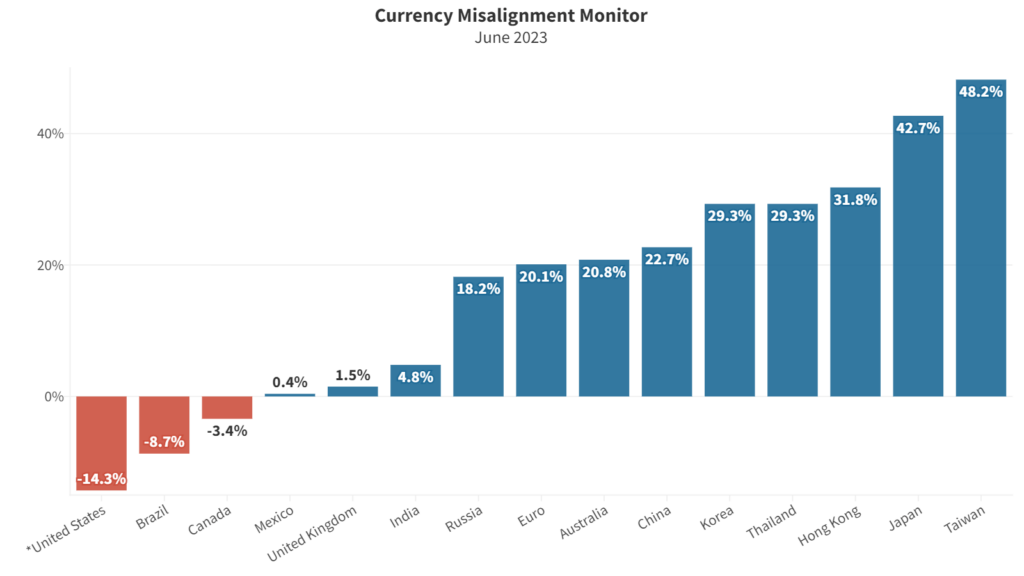
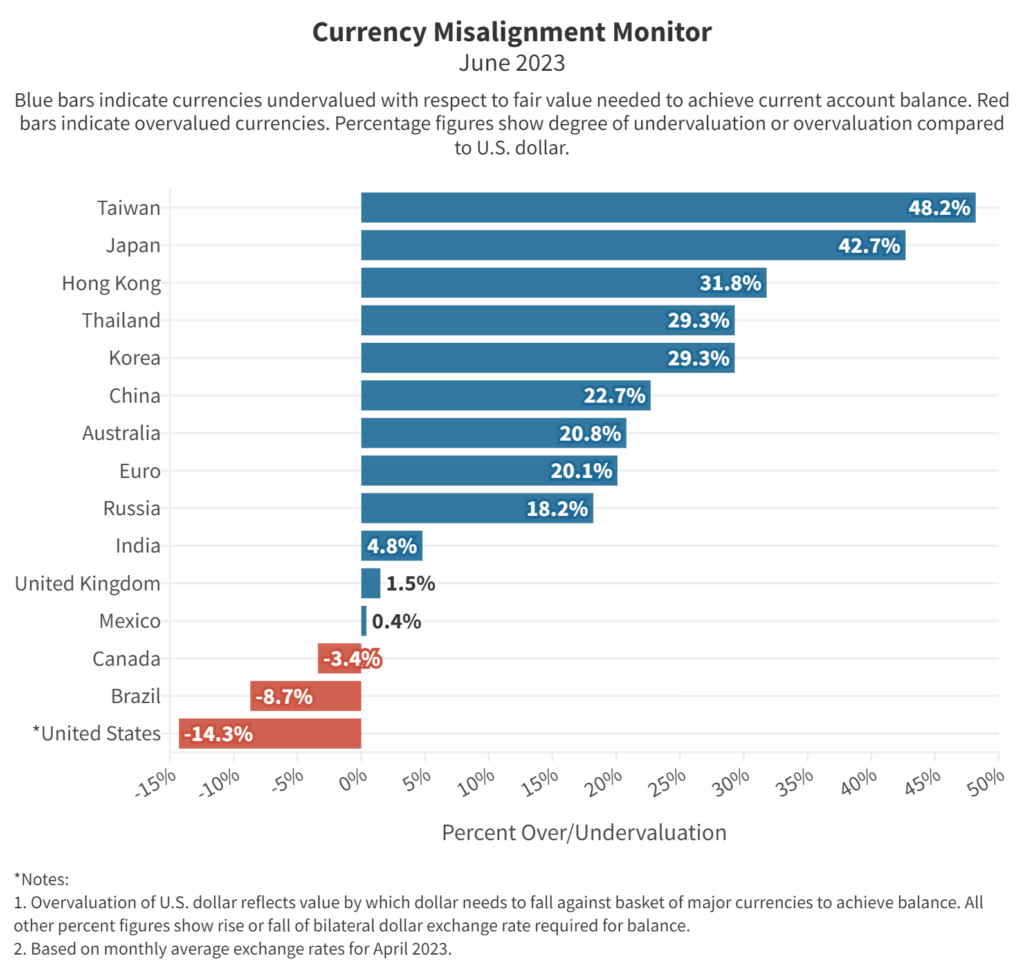
- Monthly index tracks currency misalignment based on latest market rates
- Dollar is 14.3% overvalued against global currencies
- Overvalued dollar contributes to trade deficits costing by some estimates 6 million jobs, many in manufacturing
- Japanese yen undervaluation against U.S. dollar surges to 42.7%
- Chinese yuan undervaluation against dollar rises to 22.7%
- CMM is a partnership between the Coalition for a Prosperous America (CPA) and the Blue Collar Dollar Institute (BCDI).
Misalignment has increased since last month’s report. The dollar is 14.3% overvalued against a basket of major global currencies, up significantly from 11.5% last month. Overvaluation on this scale makes U.S. goods and services less competitive with foreign imports in the U.S. market and less competitive on global export markets. The loss of competitiveness is more severe against the currencies of those nations which take action to maintain their currencies at artificially low levels such as Japan or Taiwan. The increase in misalignment since last month is a result of moves in exchange rates on global markets and tweaks by the IMF to its forecasts of national current account balances. The forecasts are important because our currency misalignment monitor estimates what currency values would be needed to eliminate excessive current account surpluses and deficits.
The Japanese yen is 42.7% undervalued against the dollar, a huge competitive advantage for Japanese products in competition with American products. Taiwan’s currency, the Taiwanese dollar, is 48.2% undervalued against the dollar. Our analysis is based on average exchange rates for the month of April and therefore do not include the most recent currency moves. With the yen falling to 140 to the dollar in recent days, a level not seen since 1998, the yen could be even more undervalued in next month’s report. The currencies of South Korea, China, and the Eurozone are now all undervalued by more than 20%, giving those nations substantial advantages in global markets and especially in exporting to the U.S.
Since 2011, the U.S. dollar has risen by 48%, as measured by the Federal Reserve’s broad dollar index. In 1985, the U.S. dollar had also risen by over 40%, increasing the U.S. trade deficit, eliminating thousands of U.S. jobs and putting many U.S. producers into difficulties. In September of that year, U.S. Treasury Secretary Jim Baker and the finance ministers of four other major nations took action in the Plaza Accord to realign the dollar’s value to restore American competitiveness. Their intervention drove the dollar value down by some 40% within two years, leading to a much-reduced trade and current account deficit.
Today, the overvalued dollar and the undervalued currencies of large exporting nations like China and the Eurozone contribute mightily to the U.S. goods trade deficit, running at over $1 trillion a year. The standard rule of thumb that every billion dollars of imports costs us 6,000 jobs indicates that our current trade deficit costs the U.S. six million lost jobs. Most of those lost jobs would be well-paid jobs in the manufacturing sector. Undervalued currencies in Japan, South Korea, and the Eurozone give a huge competitive advantage to automobiles and other imported products from those countries.
Other costs of the overvalued dollar include hits to the global earnings of U.S. corporations. Many companies reported Q1 earnings disappointments due partly to the rising foreign exchange value of the dollar. Johnson and Johnson, for example, said foreign exchange cost the company $3 billion last year. IBM said its first quarter results would have showed a 4.4 percent increase in revenue but for the rising dollar which reduced the impact of foreign earnings, leaving the company with a 0.4 percent increase in first quarter revenue.
Table 1. Currency valuations from the Currency Misalignment Monitor, June 2023
| Currency | Over or Under | % Over/Under valuation (1) | Latest rate | FEER-consistent dollar rate (2) | |
| US | Dollar | Overvalued | -14.3% | 1.00 | 1.00 |
| China | Yuan | Undervalued | 22.7% | 6.89 | 5.62 |
| Japan | Yen | Undervalued | 42.7% | 134 | 94 |
| Korea | Won | Undervalued | 29.3% | 1324 | 1024 |
| Taiwan | TWD | Undervalued | 48.2% | 31 | 21 |
| Eurozone | Euro | Undervalued | 20.1% | 1.10 | 1.32 |
| UK | Pound | Undervalued | 1.5% | 1.24 | 1.26 |
| Mexico | Peso | Undervalued | 0.4% | 18.1 | 18.0 |
| Canada | C$ | Overvalued | -3.4% | 1.35 | 1.40 |
| India | Rupee | Undervalued | 4.8% | 82.0 | 78.2 |
| Brazil | Real | Overvalued | -8.7% | 5.01 | 5.49 |
| Notes: 1. % Over/Undervaluation is for U.S. dollar’s Real Effective Exchange Rate as compared to the basket of currencies. For all other currencies, over/undervaluation refers to bilateral relationship to the dollar. Negative (red) figures indicate overvaluation, black indicates undervaluation. | |||||
| 2. FEER-consistent rate shows bilateral dollar exchange rate after each currency has moved to its Fundamental Equilibrium Exchange Rate. | |||||
| 3. Pound and Euro rates are expressed as dollars per those currencies. All others are currency per dollar. | |||||
The CMM is based on a mathematical model in which 34 major currencies all move simultaneously to bring global current accounts into balance over a five-year time horizon. If the dollar had to move on its own, the dollar would need to move by approximately twice as much, or around 25%, to achieve fair value for the U.S. economy, i.e. a value that eliminated the current account deficit. The current account deficit is dominated by the trade deficit, but also includes some other flows into and out of the U.S.
METHODOLOGY
The Currency Misalignment Monitor is based on pioneering work done by William Cline at the Peterson Institute for International Economics. The Cline model, also known as SMIM for Symmetric Matrix Inversion Method, uses IMF forecasts for current account balances for 34 nations to derive a simultaneous solution for all exchange rates that will minimize national current account balances, including surpluses and deficits. The CMM uses this methodology. However, the Cline version sets a target of plus or minus 3% of GDP for each nation’s current account. We believe this is too flexible for a properly functioning global trading system. Our model sets a target of 0% current account balance for each nation. Most nations do not achieve 0% in year five, but the model seeks to get them as close to zero as possible and in so doing gives us a realistic sense of each currency’s over or undervaluation.
Note also that this methodology is dependent on IMF forecasts, which currently run from 2022 data out to 2027. The IMF has a history of optimism, including for example expectations that the U.S. current account deficit and the China surplus will both contract over time. If those forecasts turn out to be over-optimistic, then the misalignment estimates in the Monitor could well be understated. Nevertheless the Cline SMIM model is an innovative method for incorporating a large amount of global data into a single model.
The Currency Misalignment Monitor (CMM) is published in partnership between the Coalition for a Prosperous America (CPA) and the Blue Collar Dollar Institute (BCDI).


