[vc_row][vc_column][vc_column_text]
- Monthly index tracks currency misalignment based on latest market rates
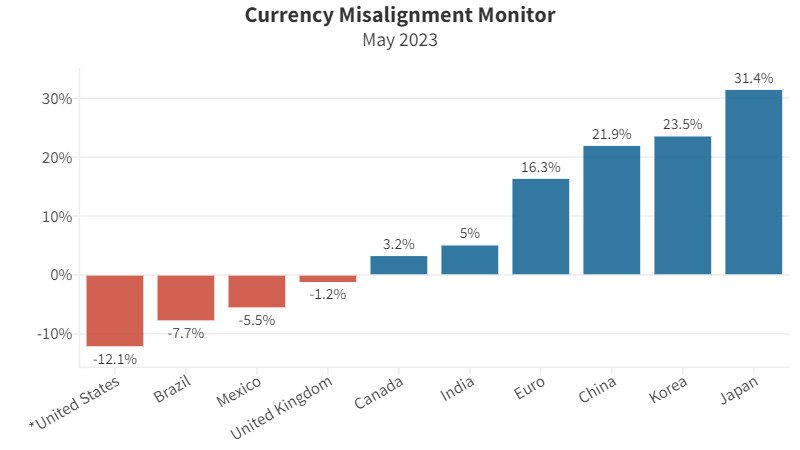
- Dollar is 12.1% overvalued
- Japanese yen undervaluation expands slightly to 31.4%
- Chinese yuan undervaluation expands slightly to 21.9%
- CMM is a partnership between the Coalition for a Prosperous America (CPA) and the Blue Collar Dollar Institute (BCDI).
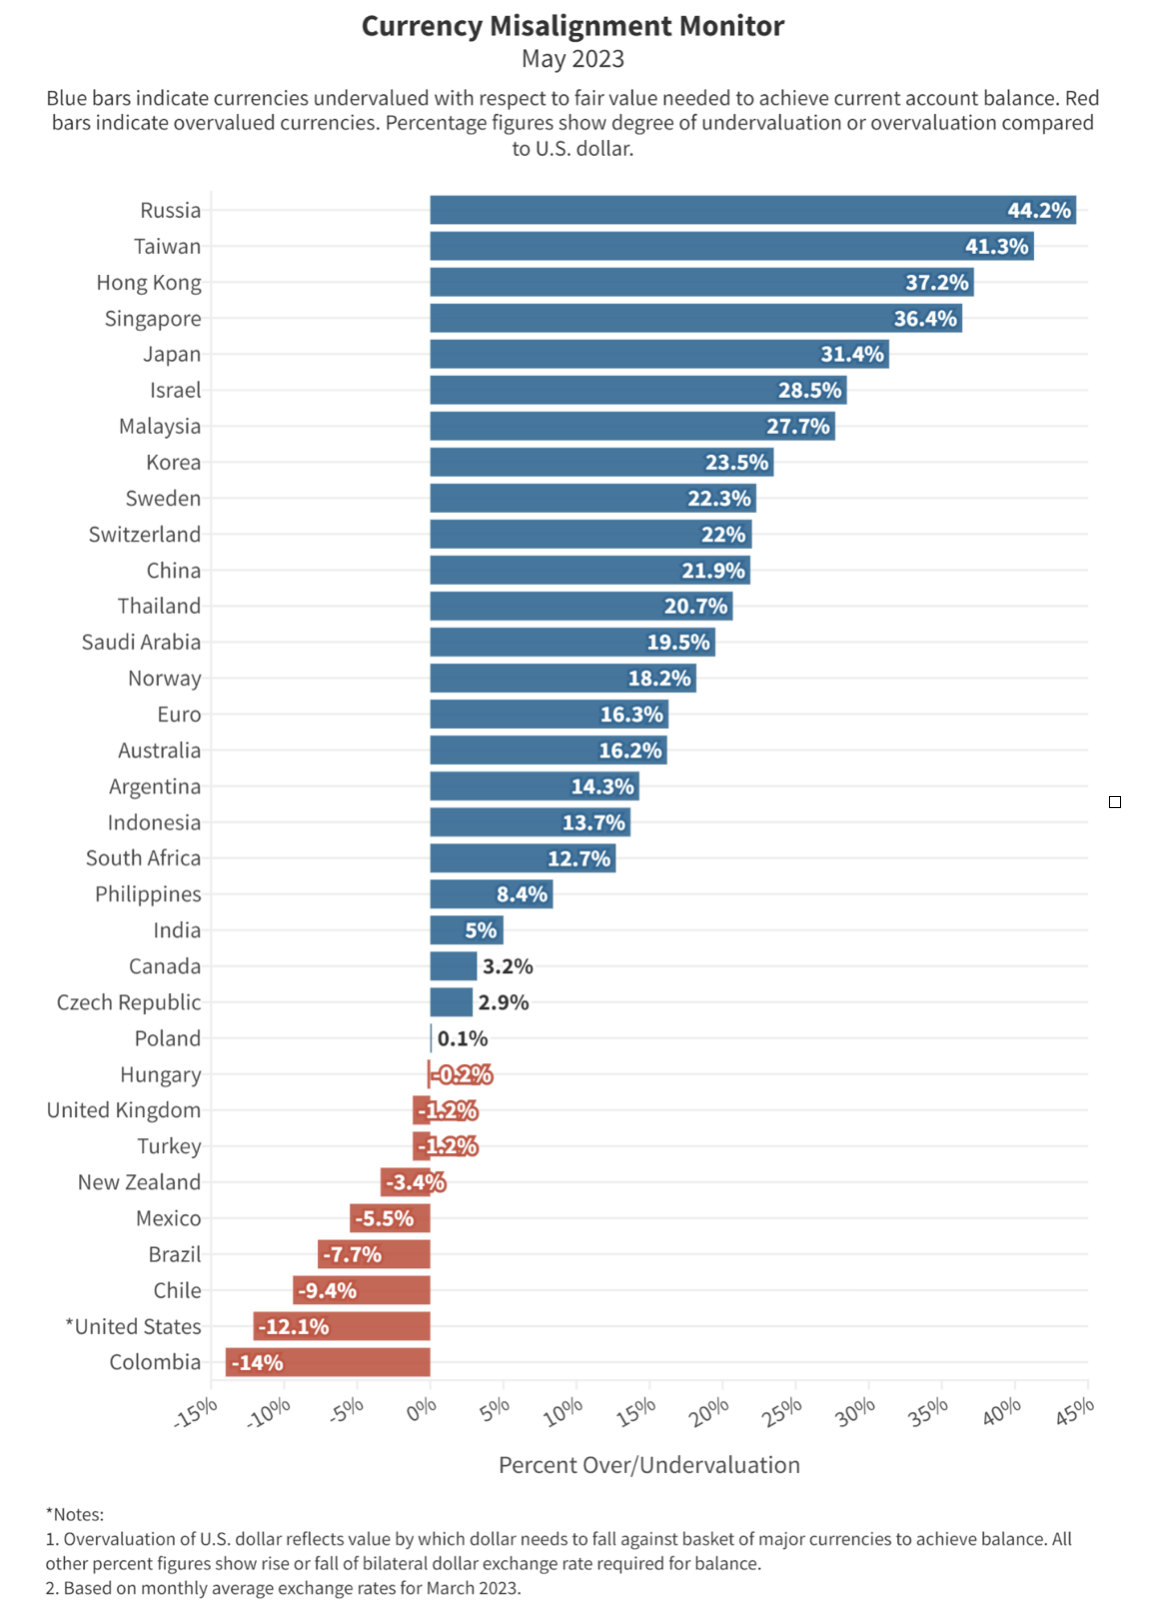
The U.S. dollar has edged up slightly since our last Misalignment Monitor a month ago. It’s now 12.1% overvalued. The undervaluations of Japan and China have also increased, to 31.4% and 21.9%, respectively. Such large undervaluations give a substantial boost to Chinese and Japanese exports and trade surpluses. An even larger undervaluation belongs to Taiwan, which is 41.3% undervalued.
Our estimates are based on real (inflation-adjusted) exchange rate data for the month of March from the Bank of International Settlements. In March, two major U.S. banks failed and the federal government was forced to take action to protect depositors. Only this week, a third mid-sized bank, First Republic, was rescued by J.P. Morgan Chase bank. These bank failures generated worries in the financial markets that the U.S. and the world might be headed towards another financial crisis and global recession, as in 2008. Such worries typically drive international investors to buy dollar assets such as Treasury bonds, since dollar assets are viewed as the safest holdings in times of uncertainty and fear. Such purchases likely contributed to a rise in the dollar’s value.
U.S. Treasury data shows that foreign inflows into U.S. securities and bank deposits in 2022 were $1.6 trillion, up 45% from the total inflows in 2021. Large financial flows are the most significant driving force in foreign exchange rates. This puts U.S. manufacturers at a disadvantage when competing with imports or with foreign producers in export markets, because exchange rates do not move to equilibrate trade. Instead, they react to large financial flows, which are governed by expectations about economic performance, interest rates, stock market returns, and other, mostly financial, factors.
Table 1. Currency valuations from the Currency Misalignment Monitor, May 2023
| Currency Misalignment Monitor, May 2023 | |||||
| Currency | Over or Under | % Over/Under valuation (1) | Latest rate | FEER-consistent dollar rate (2) | |
| US | Dollar | Overvalued | -12.1% | 1.00 | 1.00 |
| China | Yuan | Undervalued | 21.9% | 6.89 | 5.65 |
| Japan | Yen | Undervalued | 31.4% | 134 | 102 |
| Korea | Won | Undervalued | 23.5% | 1306 | 1058 |
| Eurozone | Euro | Undervalued | 16.3% | 1.07 | 1.25 |
| UK | Pound | Overvalued | -1.2% | 1.21 | 1.20 |
| Mexico | Peso | Overvalued | -5.5% | 18.4 | 19.5 |
| Canada | C$ | Undervalued | 3.2% | 1.37 | 1.33 |
| India | Rupee | Undervalued | 5.0% | 82.3 | 78.4 |
| Brazil | Real | Overvalued | -7.7% | 5.21 | 5.65 |
| Notes: 1. % Over/Undervaluation is for U.S. dollar’s Real Effective Exchange Rate as compared to the basket of currencies. For all other currencies, over/undervaluation refers to bilateral relationship to the dollar. Negative (red) figures indicate overvaluation, black indicates undervaluation. | |||||
| 2. FEER-consistent rate shows bilateral dollar exchange rate after each currency has moved to its Fundamental Equilibrium Exchange Rate. | |||||
| 3. Pound and Euro rates are expressed as dollars per those currencies. All others are currency per dollar. | |||||
The CMM is based on a mathematical model in which 34 major currencies all move simultaneously to bring global current accounts into balance over a five-year time horizon. If the dollar had to move on its own, the dollar would need to move by approximately twice as much, or around 25%, to achieve fair value for the U.S. economy, i.e. a value that eliminated the current account deficit. The current account deficit is dominated by the trade deficit, but also includes some other flows into and out of the U.S.
METHODOLOGY
The Currency Misalignment Monitor is based on pioneering work done by William Cline at the Peterson Institute for International Economics. The Cline model, also known as SMIM for Symmetric Matrix Inversion Method, uses IMF forecasts for current account balances for 34 nations to derive a simultaneous solution for all exchange rates that will minimize national current account balances, including surpluses and deficits. The CMM uses this methodology. However, the Cline version sets a target of plus or minus 3% of GDP for each nation’s current account. We believe this is too flexible for a properly functioning global trading system. Our model sets a target of 0% current account balance for each nation. Most nations do not achieve 0% in year five, but the model seeks to get them as close to zero as possible and in so doing gives us a realistic sense of each currency’s over or undervaluation.
Note also that this methodology is dependent on IMF forecasts, which currently run from 2022 data out to 2027. The IMF has a history of optimism, including for example expectations that the U.S. current account deficit and the China surplus will both contract over time. If those forecasts turn out to be over-optimistic, then the misalignment estimates in the Monitor could well be understated. Nevertheless the Cline SMIM model is an innovative method for incorporating a large amount of global data into a single model.
The Currency Misalignment Monitor (CMM) is published in partnership between the Coalition for a Prosperous America (CPA) and the Blue Collar Dollar Institute (BCDI).
[/vc_column_text][/vc_column][/vc_row]