- Monthly index tracks currency misalignment based on latest market rates
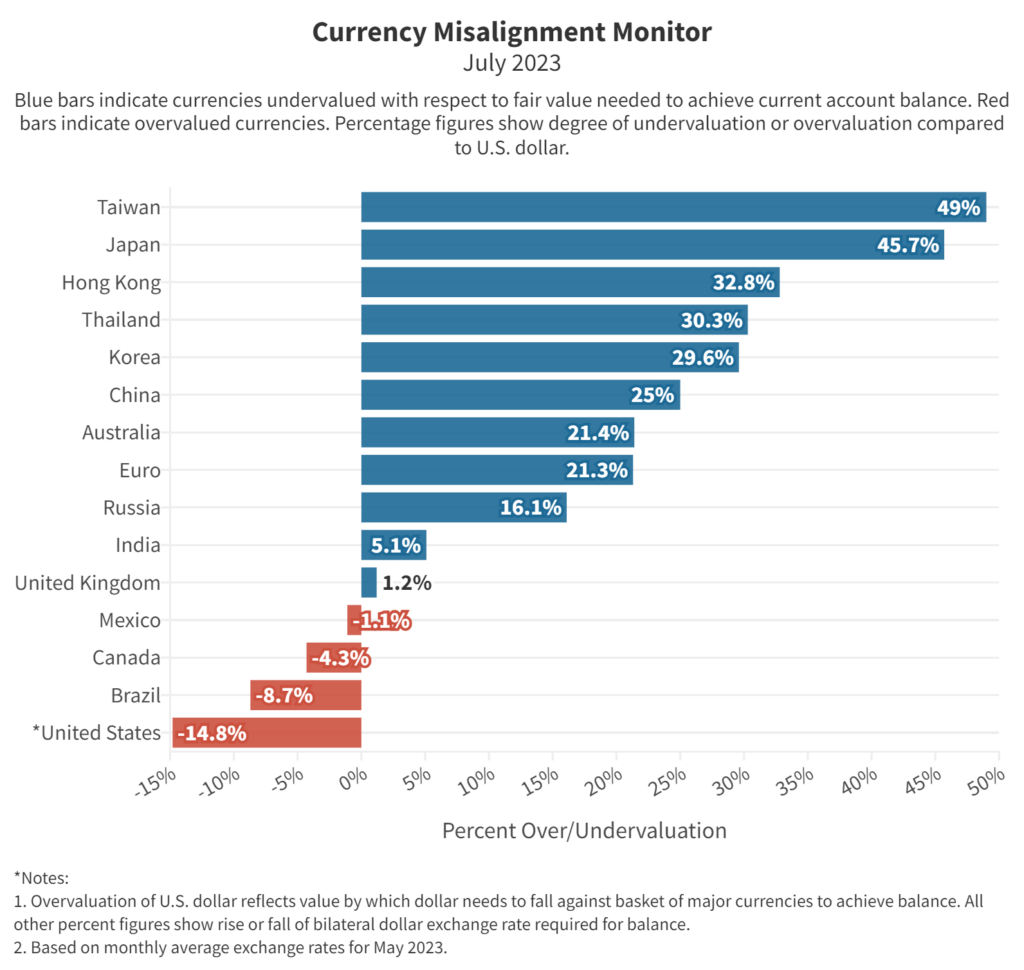
- Dollar overvaluation rises to 14.8% against global currency basket from 14.3% last month
- Japanese yen undervaluation against U.S. dollar expands further to 45.7%
- Chinese yuan undervaluation against dollar rises to 25.0%
- CMM is a partnership between the Coalition for a Prosperous America (CPA) and the Blue Collar Dollar Institute (BCDI).
Global currency misalignment increased last month as financial markets reacted to the uncertain state of the global economy by bidding the dollar higher. The dollar’s overvaluation has edged up to 14.8% on a global basis. Robust job growth in the U.S. and stubbornly high core inflation make it likely the U.S. will raise interest rates again this summer. The prospect of higher interest rates, combined with worries about a possible global recession, attract capital into the U.S., pushing up the dollar.
On a bilateral basis, the dollar’s overvaluation is worse. Our global currency model shows Japan’s currency is more than 45% undervalued against the dollar. China’s yuan is now 25% undervalued, as the Chinese government has allowed the yuan to decline since January to promote Chinese exports. The Chinese government influences the value of the yuan by setting a so-called “reference rate” weekly, and through foreign exchange market intervention.
The overvalued dollar contributes to the U.S. goods trade deficit, now running at a $1 trillion a year level for the second consecutive year. The overvalued dollar and undervalued yuan played a role in John Deere’s decision last week to distribute electric mowers from Chinese maker Chervon in the U.S., raising questions about whether Deere will continue to develop its own. The currency advantage boosts exports from the leading Asian producers including China, Japan, Taiwan, Thailand and South Korea.
The euro is undervalued on a global basis by 6.2% according to our model. This helps European Union nations, especially the more efficient producers like Germany, maximize their exports and run trade surpluses. But since the U.S. dollar is so overvalued, the euro is undervalued by 21% compared to the dollar. For the first four months of this year, U.S. imports from Germany were double the level of exports and our goods trade deficit with Germany came in at $27 billion. India is in a similar position, with a currency that is 13% overvalued against all other nations, but nevertheless 5.1% undervalued compared to the dollar. While India is at a disadvantage in selling to China or Japan, it has a currency advantage selling to the U.S. Our goods trade deficit with India for the first four months of 2023 totaled $15 billion.
Last week, at an international forum for central banks hosted by the European Central Bank in Sintra, Portugal, there was much talk from central bankers (including America’s Jerome Powell) of the likely need for more interest rate increases in the second half of this year. That suggests more financial instability, economic uncertainty, and further upward pressure on the dollar.
Table 1. Currency valuations from the Currency Misalignment Monitor, July 2023
| Currency Misalignment Monitor, July 1, 2023 | |||||
| Currency | Over or Under | % Over/Under valuation (1) | Latest rate | FEER-consistent dollar rate (2) | |
| US | Dollar | Overvalued | -14.8% | 1.00 | 1.00 |
| China | Yuan | Undervalued | 25.0% | 6.99 | 5.59 |
| Japan | Yen | Undervalued | 45.7% | 137 | 94 |
| Korea | Won | Undervalued | 29.6% | 1327 | 1024 |
| Eurozone | Euro | Undervalued | 21.3% | 1.09 | 1.32 |
| UK | Pound | Undervalued | 1.2% | 1.25 | 1.26 |
| Mexico | Peso | Overvalued | -1.1% | 17.7 | 17.9 |
| Canada | C$ | Overvalued | -4.3% | 1.35 | 1.41 |
| India | Rupee | Undervalued | 5.1% | 82.3 | 78.3 |
| Brazil | Real | Overvalued | -8.7% | 4.98 | 5.45 |
| Notes: 1. % Over/Undervaluation is for U.S. dollar’s Real Effective Exchange Rate as compared to the basket of currencies. For all other currencies, over/undervaluation refers to bilateral relationship to the dollar. Negative (red) figures indicate overvaluation, black indicates undervaluation. | |||||
| 2. FEER-consistent rate shows bilateral dollar exchange rate after each currency has moved to its Fundamental Equilibrium Exchange Rate. | |||||
| 3. Pound and Euro rates are expressed as dollars per those currencies. All others are currency per dollar. | |||||
The CMM is based on a mathematical model in which 34 major currencies all move simultaneously to bring global current accounts into balance over a five-year time horizon. If the dollar had to move on its own, the dollar would need to move by approximately twice as much, or around 25%, to achieve fair value for the U.S. economy, i.e. a value that eliminated the current account deficit. The current account deficit is dominated by the trade deficit, but also includes some other flows into and out of the U.S.
METHODOLOGY
The Currency Misalignment Monitor is based on pioneering work done by William Cline at the Peterson Institute for International Economics. The Cline model, also known as SMIM for Symmetric Matrix Inversion Method, uses IMF forecasts for current account balances for 34 nations to derive a simultaneous solution for all exchange rates that will minimize national current account balances, including surpluses and deficits. The CMM uses this methodology. However, the Cline version sets a target of plus or minus 3% of GDP for each nation’s current account. We believe this is too flexible for a properly functioning global trading system. Our model sets a target of 0% current account balance for each nation. Most nations do not achieve 0% in year five, but the model seeks to get them as close to zero as possible and in so doing gives us a realistic sense of each currency’s over or undervaluation.
Note also that this methodology is dependent on IMF forecasts, which currently run from 2023 data out to 2028. The IMF has a history of optimism, including for example expectations that the U.S. current account deficit and the China surplus will both contract over time. If those forecasts turn out to be over-optimistic, then the misalignment estimates in the Monitor could well be understated. Nevertheless the Cline SMIM model is an innovative method for incorporating a large amount of global data into a single model.
The Currency Misalignment Monitor (CMM) is published in partnership between the Coalition for a Prosperous America (CPA) and the Blue Collar Dollar Institute (BCDI).