- Monthly index tracks currency misalignment based on latest market rates
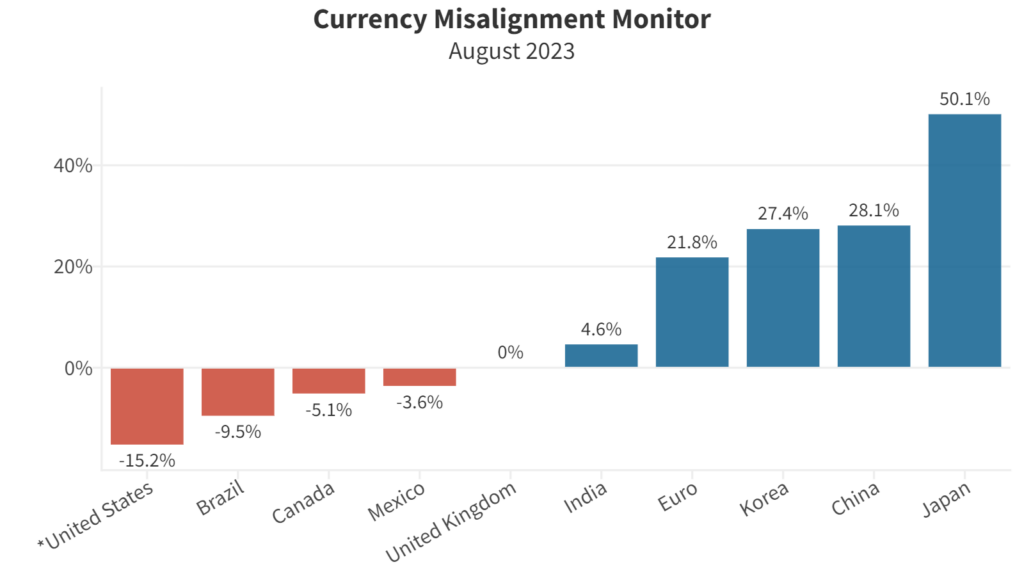
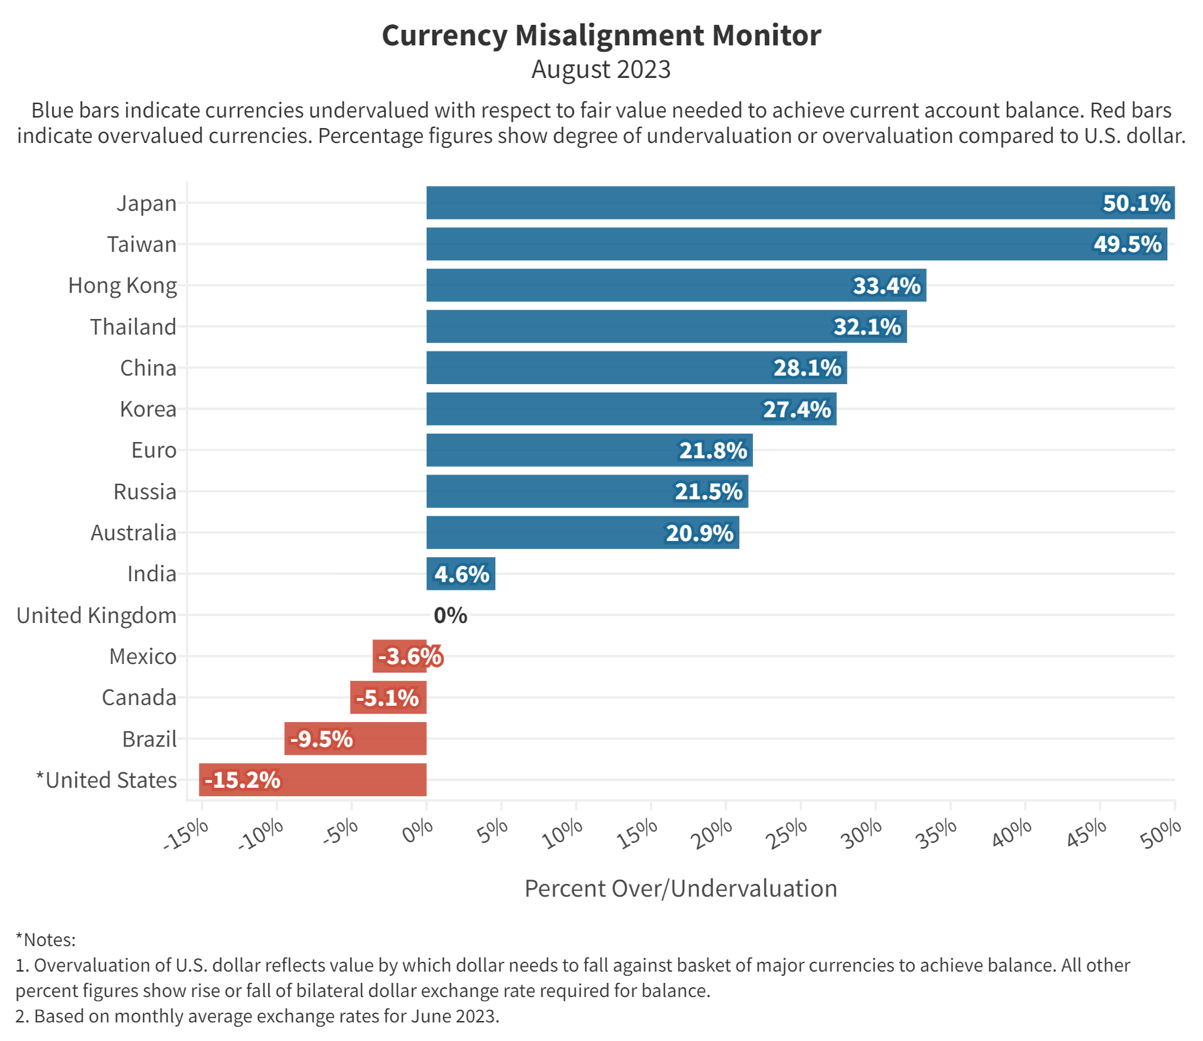
- Dollar overvaluation rises to 15.2% against global currency basket as dollar inflows continue to push up the greenback.
- Japanese yen undervaluation against U.S. dollar reaches 50.1%, a new all-time low for the yen in dollar terms.
- Chinese yuan undervaluation against dollar rises to 28.1%
- CMM is a partnership between the Coalition for a Prosperous America (CPA) and the Blue Collar Dollar Institute (BCDI).
The U.S. dollar continues to rise in our latest monthly update of the Currency Misalignment Monitor, increasing the currency disadvantage for U.S. manufacturers and farmers competing against imports in the home market and against global competition in foreign markets. The latest reading shows the U.S. dollar overvaluation at 15.2% against a global basket of currencies.
The dollar has continued to rise in the first half of this year due to capital inflows from international investors. The inflows are driven by expectations of continued U.S. interest rate increases and this year’s optimism in the U.S. stock market. The Federal Reserve raised interest rates last week, and is expected to do so at least once more in the second half of this year. Meanwhile, the NASDAQ 100 index of major tech stocks was up 39.4% in the first half of 2023, driven largely by excitement over artificial intelligence, attracting global investor money into the U.S. Big Tech stocks that dominate AI software.
At half of its fair value against the dollar, Japanese exporters including manufacturers of automobiles, electronics, and other consumer goods, have a huge unfair advantage in the U.S. market. Chinese exporters’ advantage of 28.1% is also very large. China’s currency advantage in the U.S. market outweighs the disadvantage from even the highest level of Section 301 tariffs, set at 25%.
In economic theory dating back 250 years, exchange rates should be set at values that allow nations to trade fairly with each other, with every nation’s trade balance at or close to zero. This ensures that no nation is taking unfair advantage of its neighbors. Establishing fair values is not easy, because foreign exchange rates can be maintained at levels far from fair value for many years. Exchange rates are subject to manipulation by governments and distortion by international capital flows such as those that have held the dollar far above a competitive level for many years. Our economic model is based on methodology developed at Peterson Institute by economist William Cline. This model, known as SMIM for Simultaneous Inverted Matrix Model, takes the 34 largest trading nations, which have varying levels of surplus and deficit, and calculates how much each currency would need to move today to lead its current account (similar to the trade account but with some additional flows included) to reach zero within five years, in other words in 2028. The data for current levels and future estimates of GDP, trade, and current account balance come from data published by the International Monetary Fund.
In the model, as in the real world, each nation’s exchange rate and trade balance affect all its partners’ rates and trade balances. So if the U.S. reduces the dollar rate by 15.2% as in this month’s model simulation, the U.S. trade deficit would shrink to zero over the subsequent five years. But this would also shrink the surpluses of other major nations such as China and Japan. When all the currencies move to new values, each nation’s move against the global basket of 34 currencies is smaller than many of its bilateral moves, i.e. moves against individual countries. This is especially true for nations with large surpluses or deficits.
For example, the U.S. is overvalued against the yen by 50.1% but because the dollar moves by much smaller amounts against many other currencies, the average realignment of the dollar in the model is only 15.2%. The yen and the Chinese yuan see the reverse effects. The yuan is undervalued against the dollar by 28.1% but since the U.S. accounts for almost half of China’s surplus, once the dollar-yuan moves by that amount, the yuan only needs to move by much smaller amounts against other currencies to bring its current account into balance. So China’s undervaluation compared to all the other currencies averages out at just 6.6%.
In Table 1 below, we display each major nation’s currency under- or over-valuation against the U.S. dollar because that is the rate that most concerns American readers. For the U.S., it cannot be undervalued or overvalued against itself, so we show its rate against the basket of the 33 other nations in the model, weighted according to the level of trade.
The 15.2% move of the dollar against the basket of currencies assumes all the currencies are free to move to their ideal values. A U.S. policymaker who cannot influence the movements of other currencies would need to estimate how much the dollar would need to move to balance the current account assuming other currencies do not move. In that case, the dollar would need to move by a greater amount. As a rough estimate, the dollar would need to move 1.5 to 2 times as much as the model calls for, so between 22% and 30%.
With China there is an additional complication. China’s trade surplus last year was the world’s largest, at $878 billion. Its current account surplus was only $402 billion. Heavy spending by Chinese tourists and international profit repatriation by global companies from their China operations account for much of the difference. The SMIM model uses current account balances because in economic theory exchange rates should balance all international flows, not just merchandise trade. (The U.S. current account deficit of $944 billion was very close to its trade deficit of $945 billion.) This means that the adjustments the model calls for could eliminate China’s current account surplus while leaving it with a trade surplus on the order of hundreds of billions of dollars.
Nevertheless, the model provides a good rough approximation of the degree of movement of exchange rates required to bring the world into better balance.
| Currency Misalignment Monitor, August 1, 2023 | |||||
| Currency | Over or Under | % Over/Under valuation (1) | Latest rate | FEER-consistent dollar rate (2) | |
| US | Dollar | Overvalued | -15.2% | 1.00 | 1.00 |
| China | Yuan | Undervalued | 28.1% | 7.16 | 5.59 |
| Japan | Yen | Undervalued | 50.1% | 141 | 94 |
| Korea | Won | Undervalued | 27.4% | 1297 | 1018 |
| Eurozone | Euro | Undervalued | 21.8% | 1.08 | 1.32 |
| UK | Pound | Undervalued | 0.0% | 1.26 | 1.26 |
| Mexico | Peso | Overvalued | -3.6% | 17.3 | 17.9 |
| Canada | C$ | Overvalued | -5.1% | 1.33 | 1.40 |
| India | Rupee | Undervalued | 4.6% | 82.2 | 78.6 |
| Brazil | Real | Overvalued | -9.5% | 4.86 | 5.37 |
| Notes: 1. % Over/Undervaluation is for U.S. dollar’s Real Effective Exchange Rate as compared to the basket of currencies. For all other currencies, over/undervaluation refers to bilateral relationship to the dollar. Negative (red) figures indicate overvaluation, black indicates undervaluation. | |||||
| 2. FEER-consistent rate shows bilateral dollar exchange rate after each currency has moved to its Fundamental Equilibrium Exchange Rate. | |||||
| 3. Pound and Euro rates are expressed as dollars per those currencies. All others are currency per dollar. | |||||
The CMM is based on a mathematical model in which 34 major currencies all move simultaneously to bring global current accounts into balance over a five-year time horizon. If the dollar had to move on its own, the dollar would need to move by approximately twice as much, or around 25%, to achieve fair value for the U.S. economy, i.e. a value that eliminated the current account deficit. The current account deficit is dominated by the trade deficit, but also includes some other flows into and out of the U.S.
METHODOLOGY
The Currency Misalignment Monitor is based on pioneering work done by William Cline at the Peterson Institute for International Economics. The Cline model, also known as SMIM for Symmetric Matrix Inversion Method, uses IMF forecasts for current account balances for 34 nations to derive a simultaneous solution for all exchange rates that will minimize national current account balances, including surpluses and deficits. The CMM uses this methodology. However, the Cline version sets a target of plus or minus 3% of GDP for each nation’s current account. We believe this is too flexible for a properly functioning global trading system. Our model sets a target of 0% current account balance for each nation. Most nations do not achieve 0% in year five, but the model seeks to get them as close to zero as possible and in so doing gives us a realistic sense of each currency’s over or undervaluation.
Note also that this methodology is dependent on IMF forecasts, which currently run from 2023 data out to 2028. The IMF has a history of optimism, including for example expectations that the U.S. current account deficit and the China surplus will both contract over time. If those forecasts turn out to be over-optimistic, then the misalignment estimates in the Monitor could well be understated. Nevertheless the Cline SMIM model is an innovative method for incorporating a large amount of global data into a single model.
The Currency Misalignment Monitor (CMM) is published in partnership between the Coalition for a Prosperous America (CPA) and the Blue Collar Dollar Institute (BCDI).
PREVIOUS MONTHS: