Trade remedies helped U.S. manufacturers survive being swamped by Asian overcapacity, protected domestic labor markets, and never led to the devastation and disruption the opposition warned about if imports were curtailed. Solar and steel are two cases in point and are the most well-known. Kitchen cabinets are another sector that’s expanded due to trade remedies.
For solar, there is potential for more tariffs. A California company named Auxin Solar is behind a new trade case against four Southeast Asian nations. Auxin claims Chinese companies are circumventing anti-dumping tariffs imposed on them for the third time in 2018 by increasing exports out of Southeast Asia. Imports from these four countries accounted for around 80% of all solar cell and solar module imports in 2021.
U.S. Solar Manufacturers vs the China Import Lobby
On the other side of the tariff debate are the importers, led by the Solar Energy Industries Association (SEIA). They represent solar project consultants, residential solar installers like Sunrun, along with construction and engineering firms. And most of the Chinese exporters.
SEIA tells Capitol Hill and the press the same thing they have said since 2012, that anti-dumping and countervailing duties (AD/CVD) will cause prices to rise, lay off thousands of solar workers, and reduce installations.
Price and installation are the key soundtrack to this broken record because they speak to the White House’s current fears of inflation and climate change.
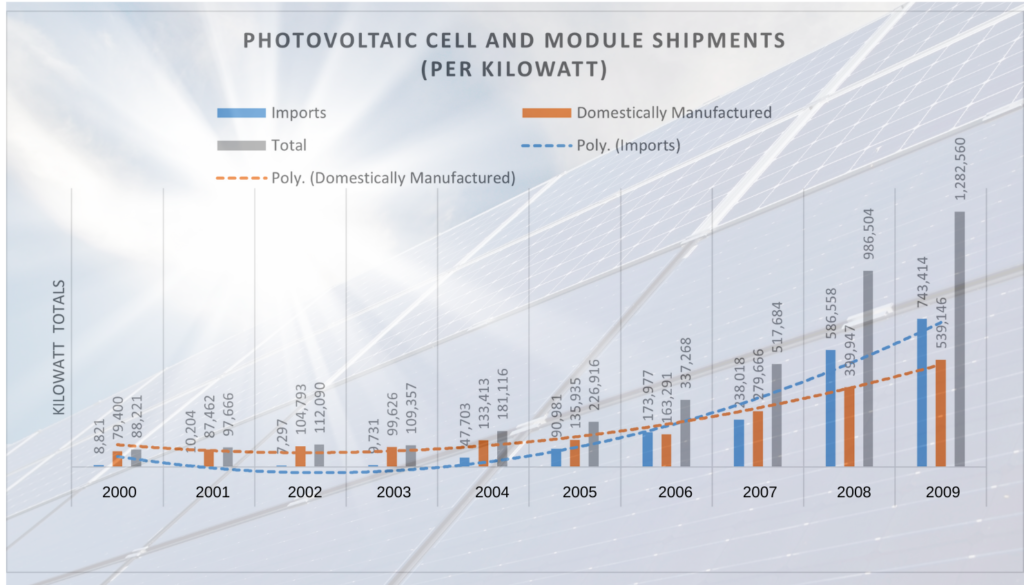
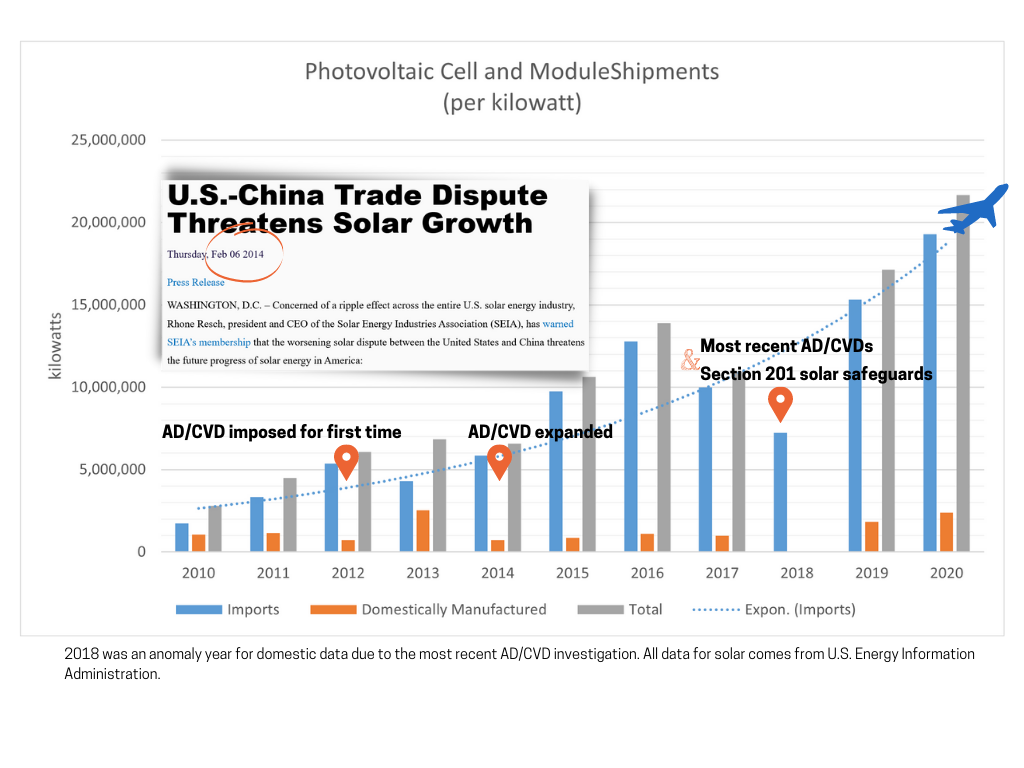
Here is how imports have grown over time as a part of domestic shipments.
 The above chart shows the U.S. solar industry growing between 2000 and 2009. By 2005, China solar companies like Jinko Solar and JA Solar, two of the world’s largest, were born. They quickly gained market share. By 2011, they dominated it.
 The only reductions in solar shipments and installations came shortly after tariffs were imposed. Each time, imports quickly recovered. Imports broke records in 2019 and 2020 following the renewal of AD/CVDs against China and the Section 201 tariffs on solar worldwide. Scare tactics about pricing and installations are designed to convince those concerned about climate change that tariffs mean less imports and less imports means higher prices and therefore less installations. This chart shows that was false in the past and will be false in the future.
None of the devastation the importers had forecasted ever occurred. Disruptions were short-lived and often due to state policy changes and shifting business strategies. Even SEIA admits this.
For pricing, solar was over $1 per kilowatt-hour in 2012 when Chinese solar cells were hit with anti-dumping charges, according to the Energy Information Administration. Prices fell below $1 in 2014 when Chinese solar panels were added to the anti-dumping tariff, and then fell below $0.50 in 2018 when the AD/CVDs were extended and global solar was hit with Section 201 safeguard tariffs.
It is safe to assume that any disruption in prices due to duties will be short-lived, often due to state intervention, or China withholding shipments to enact policy pressures in the U.S.
Solar forecasts from SEIA and Wood Mackenzie published in 2017 showed expected installations of around 15 gigawatts for 2020. In both 2020 and 2021, the U.S. saw record solar installations of 19GW and 23GW, respectively. This comes after the most tariffs against solar, ever.
“In 2020 and 2021 we had price declines in solar panels and two record years for U.S. domestic solar installations,” said Jeff Ferry, chief economist at CPA. “Tariffs do not slow down market growth when you have fundamental drivers for market growth as you do in renewable energy. Further, tariffs may have zero impact on prices when you have sufficient competition in the domestic market.”
Steel faced the same hand-wringing over pricing.
Section 232 for U.S. Steel
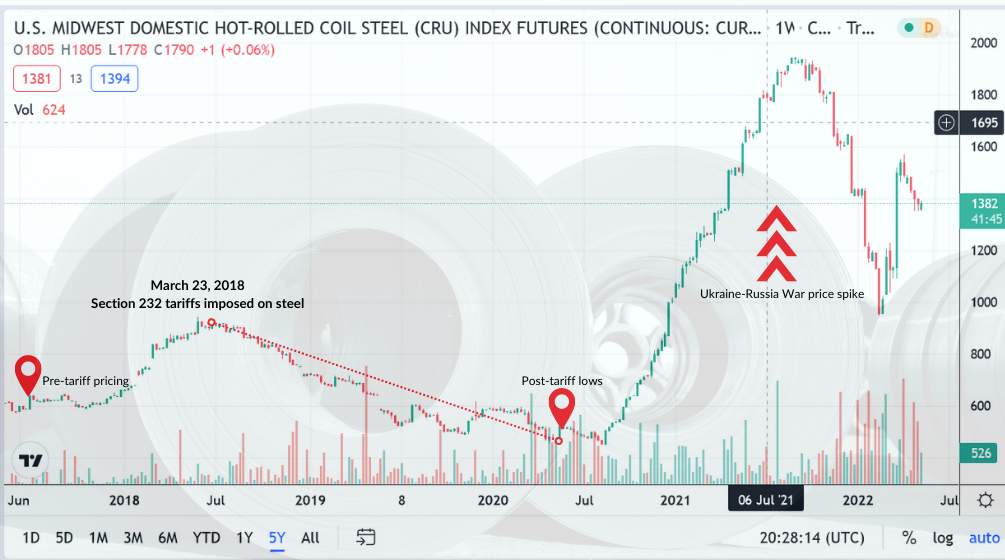
Steel tariffs were imposed worldwide in 2018.
Prices of hot-rolled steel rose in the first few months when the Section 232s were imposed, but quickly fell to pre-tariff levels.

Despite layoffs in recent years, steelmakers have invested more than $15.7 billion since 2019 into new or upgraded steel facilities in Kentucky, West Virginia, and North Carolina to name a few. These mills will come online within the next year, and they will be hiring.
In 2016, the U.S. steel industry had some 137,900 employees, falling to 137,600 a year later. Once the 232s and corporate tax cuts went into effect, the industry went from 140,700 staffers in 2018 to 145,700 in 2019. In 2017, the year before the section 232 took effect, the foreign market share of finished steel mill products was 26.9%, most of it shipped from Asia. By 2020, foreign market share fell to 17.8%. Even after an increase to 20.8% in 2021, foreign market share is still below pre-Section 232 levels.
Capacity utilization in the raw steelmaking sector, a key measure of long-run industry viability, increased from 74% in 2017 to 81.2% in 2021. This means companies are increasingly churning out what their mills are capable of producing. The higher the number, the better.
Some of the opposition to the steel tariffs comes from sectors that import steel to manufacture goods in the U.S. They often cite a 2019 study by the Federal Reserve that import groups translated into the loss of 75,000 jobs due to tariffs. The actual Federal Reserve report uses a percentage figure and not an actual number. It also does not single out the Section 232 tariffs in their job losses.
That report was bearish on tariffs, citing the rising costs of retaliation from countries in Europe and China. But tariffs remain one of the most powerful tools in Washington’s toolkit to reindustrialize the United States after roughly 30 years of offshoring.
Public affairs firms – and special interest groups — excel at spreading confusion and uncertainty (and fear) on Capitol Hill and in influencer media outlets like Bloomberg about tariffs. In a staff editorial, on May 16, Bloomberg actually blamed the baby formula shortage on tariffs. China state media is also constantly putting out anti-tariff messaging in its English-language press, designed to get the attention of the “smart guys” on Wall Street, K Street and in influential newsrooms in New York and Washington.
Kitchen Cabinets: The Imports Continue
The kitchen cabinet industry was able to expand for a few years thanks to AD/CVDs against China. Some importers failed. Others did not. Here is Fabuwood on its website. They are one of the biggest importers of China and – now Southeast Asian – kitchen cabinetry. They are doing fine.

Publicly available producer price index data for kitchen cabinets indicate that they were stable to increasing during January 2016 to September 2019, according to the International Trade Commission.
The ITC is not charged with looking at consumer prices when considering injury to domestic industry.
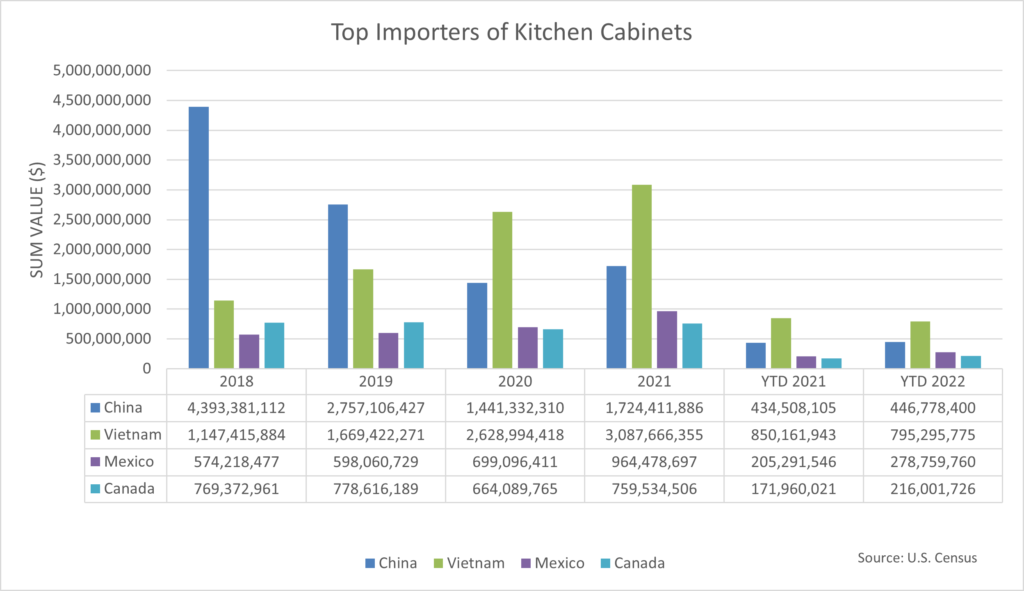
As far as the importers go, they shifted their purchases to Southeast Asia. Vietnam is taking over where China left off, keeping prices in check, and therefore having very little impact on inflation. This poses an ongoing threat, however, to local manufacturers.
 Conclusion: Importers Don’t Need Greater Markets
Prices rise and fall for a variety of reasons. Tariff price increases were as temporary as any other price increase, like rising nickel and steel prices due to the Ukraine war.
Regardless, the ITC is not tasked with making sure consumer prices stay flat. They are tasked with making sure domestic manufacturers are not being out-subsidized and over-supplied in their market, both of which can lead to market-crushing injuries that actually do lead to job losses. U.S. manufacturers have lost millions of jobs due to these practices and offshoring for the past 30 years. Importers do not need greater market share. The U.S. is on par for another record-breaking goods trade deficit, likely closing in on $1.15 trillion this year.
Markets readjusted to the AD/CVDs and Section 232s. U.S. manufacturers did better than they would have otherwise as all of them will attest. Imports remained steady or were displaced out of mainland China.
“If tariffs increase the number of high-wage jobs in the U.S., then they contribute to U.S. economic growth,” said Ferry, who calculates that for every $1 billion in the goods trade deficit, some 6,000 jobs could have been created at home. “Opening the door to higher-paying manufacturing jobs is simply good economic policy.”
How The Record Q1 U.S. Trade Deficit Shrank the Economy
How Trade Remedies Helped U.S. Manufacturers
Trade remedies helped U.S. manufacturers survive being swamped by Asian overcapacity, protected domestic labor markets, and never led to the devastation and disruption the opposition warned about if imports were curtailed. Solar and steel are two cases in point and are the most well-known. Kitchen cabinets are another sector that’s expanded due to trade remedies.
For solar, there is potential for more tariffs. A California company named Auxin Solar is behind a new trade case against four Southeast Asian nations. Auxin claims Chinese companies are circumventing anti-dumping tariffs imposed on them for the third time in 2018 by increasing exports out of Southeast Asia. Imports from these four countries accounted for around 80% of all solar cell and solar module imports in 2021.
U.S. Solar Manufacturers vs the China Import Lobby
On the other side of the tariff debate are the importers, led by the Solar Energy Industries Association (SEIA). They represent solar project consultants, residential solar installers like Sunrun, along with construction and engineering firms. And most of the Chinese exporters.
SEIA tells Capitol Hill and the press the same thing they have said since 2012, that anti-dumping and countervailing duties (AD/CVD) will cause prices to rise, lay off thousands of solar workers, and reduce installations.
Price and installation are the key soundtrack to this broken record because they speak to the White House’s current fears of inflation and climate change.
Here is how imports have grown over time as a part of domestic shipments.
None of the devastation the importers had forecasted ever occurred. Disruptions were short-lived and often due to state policy changes and shifting business strategies. Even SEIA admits this.
For pricing, solar was over $1 per kilowatt-hour in 2012 when Chinese solar cells were hit with anti-dumping charges, according to the Energy Information Administration. Prices fell below $1 in 2014 when Chinese solar panels were added to the anti-dumping tariff, and then fell below $0.50 in 2018 when the AD/CVDs were extended and global solar was hit with Section 201 safeguard tariffs.
It is safe to assume that any disruption in prices due to duties will be short-lived, often due to state intervention, or China withholding shipments to enact policy pressures in the U.S.
Solar forecasts from SEIA and Wood Mackenzie published in 2017 showed expected installations of around 15 gigawatts for 2020. In both 2020 and 2021, the U.S. saw record solar installations of 19GW and 23GW, respectively. This comes after the most tariffs against solar, ever.
Steel faced the same hand-wringing over pricing.
Section 232 for U.S. Steel
Steel tariffs were imposed worldwide in 2018.
Prices of hot-rolled steel rose in the first few months when the Section 232s were imposed, but quickly fell to pre-tariff levels.
Despite layoffs in recent years, steelmakers have invested more than $15.7 billion since 2019 into new or upgraded steel facilities in Kentucky, West Virginia, and North Carolina to name a few. These mills will come online within the next year, and they will be hiring.
Capacity utilization in the raw steelmaking sector, a key measure of long-run industry viability, increased from 74% in 2017 to 81.2% in 2021. This means companies are increasingly churning out what their mills are capable of producing. The higher the number, the better.
Some of the opposition to the steel tariffs comes from sectors that import steel to manufacture goods in the U.S. They often cite a 2019 study by the Federal Reserve that import groups translated into the loss of 75,000 jobs due to tariffs. The actual Federal Reserve report uses a percentage figure and not an actual number. It also does not single out the Section 232 tariffs in their job losses.
That report was bearish on tariffs, citing the rising costs of retaliation from countries in Europe and China. But tariffs remain one of the most powerful tools in Washington’s toolkit to reindustrialize the United States after roughly 30 years of offshoring.
Kitchen Cabinets: The Imports Continue
The kitchen cabinet industry was able to expand for a few years thanks to AD/CVDs against China. Some importers failed. Others did not. Here is Fabuwood on its website. They are one of the biggest importers of China and – now Southeast Asian – kitchen cabinetry. They are doing fine.
Publicly available producer price index data for kitchen cabinets indicate that they were stable to increasing during January 2016 to September 2019, according to the International Trade Commission.
The ITC is not charged with looking at consumer prices when considering injury to domestic industry.
As far as the importers go, they shifted their purchases to Southeast Asia. Vietnam is taking over where China left off, keeping prices in check, and therefore having very little impact on inflation. This poses an ongoing threat, however, to local manufacturers.
Prices rise and fall for a variety of reasons. Tariff price increases were as temporary as any other price increase, like rising nickel and steel prices due to the Ukraine war.
Regardless, the ITC is not tasked with making sure consumer prices stay flat. They are tasked with making sure domestic manufacturers are not being out-subsidized and over-supplied in their market, both of which can lead to market-crushing injuries that actually do lead to job losses. U.S. manufacturers have lost millions of jobs due to these practices and offshoring for the past 30 years. Importers do not need greater market share. The U.S. is on par for another record-breaking goods trade deficit, likely closing in on $1.15 trillion this year.
Markets readjusted to the AD/CVDs and Section 232s. U.S. manufacturers did better than they would have otherwise as all of them will attest. Imports remained steady or were displaced out of mainland China.
“If tariffs increase the number of high-wage jobs in the U.S., then they contribute to U.S. economic growth,” said Ferry, who calculates that for every $1 billion in the goods trade deficit, some 6,000 jobs could have been created at home. “Opening the door to higher-paying manufacturing jobs is simply good economic policy.”
MADE IN AMERICA.
CPA is the leading national, bipartisan organization exclusively representing domestic producers and workers across many industries and sectors of the U.S. economy.
TRENDING
CPA Applauds CBO Report Highlighting Revenue Gains and Minimal Economic Impact of Tariffs
CBO Report Confirms CPA View that Tariffs Raise Trillions in Government Revenue and Benefit US Industries
CPA Economist Jeff Ferry Testifies on Tariffs to Joint Economic Committee
CPA Chairman: Trump Must Tackle Mexico’s Steel Surge
New Steel Trade Measures Needed as Import Issues Impact Additional Plants
The latest CPA news and updates, delivered every Friday.
WATCH: WE ARE CPA
Get the latest in CPA news, industry analysis, opinion, and updates from Team CPA.
CHECK OUT THE NEWSROOM ➔