


Key Points
- USITC March 2023 report showed that the Section 301 and 232 tariffs boosted production in all twelve of the industries studied.
- Report shows that price increases in the product categories targeted with tariffs were very small, in the 3%-4% range, contrary to mainstream media narrative.
- Most of the tariffs targeted intermediate (industrial) goods. Downstream goods, including consumer goods, saw barely visible tariff-related price increases.
- The report estimates downstream price increases due to steel and aluminum tariffs at 0.2%.
- Section 232 steel tariffs unleashed a huge wave of steel investment, likely creating some 20,000 direct jobs.
- Tariffs, i.e. import restrictions, are a valuable tool for generating growth in the U.S. economy.
OVERVIEW
A little-noticed government report released earlier this year shows that the Section 301 and Section 232 tariffs on imports boosted U.S. domestic production across a wide range of industries. The boost in production is important because one of the goals of tariffs, especially against China imports which are focused on important manufacturing sectors, is to generate domestic growth, creating jobs, revenue, and investment in specific manufacturing sectors.
The report, Economic Impact of the Section 232 and 301 Tariffs on U.S. Industries, published by the U.S. International Trade Commission (USITC) in March this year, took an in-depth look at the effects of the 232 tariffs (steel and aluminum) and the 301 tariffs (levied on roughly half of U.S. imports from China) on the importing industries and on industries dependent on them. The authors of the report used a set of customized economic models to track the impact of the tariffs on those industries over the years 2019 through 2021. In every one of the ten industries the authors studied, the 301 tariffs led to significant increases in domestic production.
The conclusions show that the tariffs led to significant increases in domestic production in the tariffed industries. That’s the first major piece of new information in this report. Most previous studies of the impact of the tariffs ignored the impact on domestic production. This report documents its growth in 12 industrial sectors.
The second, even more significant, breakthrough in this report is to point out that there is a big difference between the price of an imported, tariffed good and what the report calls the “U.S. price” for that product. The “U.S. price” is the average price for that good including both tariffed and nontariffed goods. When a tariffed product is imported, Customs records the price of the import at the border and that data is publicly available in Department of Commerce databases. Many studies published since 2018 have found that import prices changed little or not at all after imposition of tariffs. They then added the tariff cost (typically between 10% and 25%) onto that import price and concluded this would be the post-tariff price in that industry. They then further assumed that all products in that category were selling in the U.S. at that post-tariff price.
The USITC study shows this is wrong. In fact, what has happened in all 12 of the industry sectors the report examines is that goods not affected by the tariff saw price increases far below the price increases of the tariffed goods. The report authors provide a weighted average of the tariffed goods prices and the non-tariffed goods prices to arrive at a price change in the “U.S. price” of the good. Here is an example: the price of imported, tariffed steel entering the U.S. in 2021 rose by 22.7%, close to the 25% tariff rate. However, the price of domestically produced steel rose just 0.75%. As a result, all steel sold in the U.S. in 2021 saw a tariff-related price increase of just 2.47%.
The significance of this is huge. Most academic studies of the tariffs since 2018 have assumed that since tariffed goods prices rose by close to the tariff rate, the entire set of those products sold in the U.S. must also have risen by that amount. They then concluded that these large price increases would burden with higher costs the industries that consume those tariffed goods.
That conclusion is clearly wrong. U.S. purchasers of these goods paid only the average price for all goods in that category. There were many signs of the mistake in the real world. For example, in early 2018, when steel buyers were building up stocks of steel to guard against a sudden price increase, several auto executives warned that if steel prices continued to rise, it would cut into their profits. However, in late 2018 steel prices began to fall and fell further in 2019 until they were below the January 2018 level. In the ensuing five years, no earnings report from a major automaker mentioned steel as a factor in rising costs. In other words, despite the 25% tariff, there were no significant steel cost increases related to tariffs. (There were of course large steel price increases related to the post-Covid boom of 2021-2022, which are still being unwound today.)
This phenomenon was repeated in each of the 12 industries studied by the USITC. In each case, industrywide price increases (labeled “U.S. prices” by the USITC) were far below the price increase in the goods that were actually imported and tariffed. Most of the tariffed goods were intermediate goods, sold to industrial buyers in the U.S. When these goods were incorporated into finished goods and sold to consumers, the small price increase related to the tariff was watered down still further.
This mistake (the assumption that the post-tariff price increase of tariffed goods applied to all goods in its category) led many economists to find (or assume) that downstream industries buying goods in those categories must have suffered large cost increases and therefore reduced profits, or even cut thousands of jobs. This was not true. In 2019, public company profits and employment rose.
One academic study did notice that on the retail side, tariff-related price increases were so small as to be scarcely noticeable. A 2019 study by four respected economists including Gita Gopinath, now at the IMF, and Brent Neiman, now in the U.S. Treasury, found that retail prices of tariffed goods they studied rose by a barely recognizable amount. In their words: “These estimated price increases…are not easily visible in the aggregated retail price indices that we construct to compare affected and unaffected imports.”[1] They were not easily visible because they were very small and because they were likely overwhelmed by other price movements, such as the usual price-cutting that goes on regularly in electronics goods.
Readers who are unfamiliar with how business operates (a category that unfortunately includes most academic economists) will wonder: how can tariffed import prices rise by more than all other products in the U.S. market and still find purchasers? The answer is that first, the tariffed goods saw and continue to see immediate market share falls after tariffs are imposed. For example, the USITC studied the “cut and sew apparel” sector in the report. In 2018, China accounted for 31% of U.S. imports in the sector, $25 billion out of $79 billion. By 2022, total imports in the sector were up to $95 billion. But China’s share had fallen to $19 billion or 20%.
The second part of the answer is that business typically averages its costs across all inputs and if tariffed imports are only available by paying tariffs, cost averaging will reduce the hit to Cost of Goods Sold in the profit statement, and the business can sustain differential pricing for inputs that are similar.
Taken in its entirety, the USITC report shows that on the whole, these tariffs made a positive contribution to the productive base of the U.S. economy. The tariffed industries cover many of the most important sectors of the U.S. economy. The tariffs increased domestic production in those industries, creating thousands of jobs. The small price increases that emerge from the USITC model were lost in the constant shuffling of prices that is normal in a vibrant economy. Further, tariff-related price increases were dwarfed by the later inflation of 2021-2022 that followed the disruptive events of the COVID pandemic. The constructive impact of the tariffs on U.S. production can and will endure for years to come, increasing the scale of important industries, creating jobs, and stimulating new investment.
INCREASED OUTPUT FROM AFFECTED INDUSTRIES
The USITC team of economists selected a subset of U.S. industries for which data was readily available from government sources. Using regression analysis, they estimated the drivers of price, U.S. output, imports, and the effects on downstream industries for each of the selected industries for each of the years 2018 through 2021. Next, they changed the tariff parameters to zero and re-estimated the results. The difference shows the impact of the tariff.
Table 1 below shows the impact of the 301 tariffs on the ten industries selected by the USITC. The industries range in size from audio and video equipment, with U.S. output of $8 billion, up to motor vehicle parts, worth $250 billion last year. We show in our table the results for 2021, the final year in the USITC study, although results for the previous years were very similar.
In each industry, the 301 tariffs led to an increase in U.S. production between 1.2% and 7.5%. In total, these industries’ output was worth $940 billion, and their output was increased by $38 billion or 4.1% due to the 301 tariffs. Using the rule of thumb that every billion dollars of revenue creates some 6,000 jobs, this subset of the 301 tariffs was responsible for some 230,000 jobs. Further, the ten selected industries account for about a third of the total imports impacted by the 301 tariffs. So a rough estimate would be that the 301 tariffs created some 750,000 jobs in the tariffed industries. Indirect jobs supporting those industries would add to the total.
A 4.1% increase in domestic production in these ten industries is significant but not huge. The 301 tariffs on China were motivated largely by the U.S.-China political and economic dispute rather than by an explicit desire to reshore and rebuild U.S. manufacturing industry. Much of the production that has left China since 2018 went to other foreign locations, including the Pacific Rim, India, and Mexico. A policy that imposed global tariffs or tariffs on more foreign locations than just China would have spurred a larger increase in domestic production.
Table 1: Changes in U.S. production in 10 selected industries tariffed under Section 301. All data applies to 2021 and is from the USITC study.
| Industry | NAICS code | Domestic U.S. Gross Output, $B (2021) | Change in U.S. industry gross output (2021) |
| Cut and sew apparel | 3152 | $12.4 | 6.3% |
| Semiconductors and other electronic components | 3344 | $130.9 | 6.4% |
| Computer equipment | 3341 | $39.0 | 1.2% |
| Household & institutional furniture & kitchen cabinets | 3371 | $44.7 | 7.5% |
| Motor vehicle parts | 3363 | $250.2 | 3.0% |
| Other electrical equipment and components | 3359 | $58.5 | 7.0% |
| Other miscellaneous manufacturing | 3399 | $68.0 | 2.4% |
| Audio & video equipment | 3343 | $8.1 | 6.4% |
| Other general purpose machinery | 3339 | $111.9 | 5.3% |
| Plastics products | 3261 | $207.0 | 2.8% |
| Total/Weighted Average | $930.7 | 4.1% | |
| Notes: Change in gross output represents change vs. a counterfactual model in which there were no tariffs. | |||
| Source: USITC, Economic Impact of Section 232 and 301 Tariffs on U.S. Industries, Pub. No. 5405, May 2023 | |||
PRICE INCREASES IN THE U.S. MARKET WERE VERY SMALL
The USITC study shows clearly how small were the price increases in the U.S. market due to tariffs. To reiterate, many tariffed goods saw substantial price increases. But in each sector, the price increases of non-tariffed goods in the same product category were very small. The net result was that U.S. buyers of those products saw small price increases. And those small price increases were further diluted when the intermediate goods were integrated into retail products.
Table 2 shows this clearly. The weighted average of price change in tariffed goods due to the tariffs in 2021 was 18.2%. But the weighted average of all U.S. goods in those categories was only 3.1%. In other words, the price increases paid by U.S. purchasers for goods in all ten Section 301 categories studied were on average 83% lower than the price increases paid for the specific tariffed goods from China. As an example, cut and sew apparel imported from China had its (post-tariff) price pushed up by 14.5% as a result of the tariffs. However, U.S. buyers of cut and sew apparel paid only 4.3% more for cut and sew apparel after the tariffs were imposed.
This explains the discrepancy between the many tariff critics in the U.S. Congress and elsewhere who talked about tariffs being “fully passed on” to U.S. consumers, and the fact that the U.S. consumer price index (CPI) actually fell in 2019, the year when the 301 tariffs were impacting billions of dollars of imports. The CPI rose by 2.4% in 2018, but in 2019 the CPI’s rate of increase fell significantly in 2019 to 1.8%.
Table 2: Price changes in 10 selected industries tariffed under Section 301. All data applies to 2021 and is from the USITC study.
| Industry | NAICS code | Price change of imports from China 2021 | Average price change in the U.S. market 2021 | Nontariff-inclusive total value change of imports from China 2021 |
| Cut and sew apparel | 3152 | 14.5% | 4.3% | -39.1% |
| Semiconductors and other electronic components | 3344 | 25.0% | 4.1% | -72.3% |
| Computer equipment | 3341 | 1.5% | 0.8% | -5.3% |
| Household & institutional furniture & kitchen cabinets | 3371 | 22.4% | 7.1% | -25.4% |
| Motor vehicle parts | 3363 | 24.5% | 2.3% | -50.1% |
| Other electrical equipment and components | 3359 | 21.2% | 5.5% | -37.7% |
| Other miscellaneous manufacturing | 3399 | 4.3% | 1.7% | -11.7% |
| Audio & video equipment | 3343 | 10.6% | 4.0% | -37.8% |
| Other general purpose machinery | 3339 | 19.2% | 3.8% | -47.6% |
| Plastics products | 3261 | 12.4% | 2.3% | -23.7% |
| Average | 18.2% | 3.1% | -35.1% | |
| Notes: Change in prices represents change vs. a counterfactual model in which there were no tariffs. | ||||
| Source: USITC, Economic Impact of Section 232 and 301 Tariffs on U.S. Industries, Pub. No. 5405, May 2023 | ||||
DIVERSIFICATION OF IMPORTS
Further, the imposition of the 301 tariffs has led to a rapid decline in imports from China in the tariffed categories. Table 2 shows that goods imports in these ten categories fell by 35% between imposition of the tariffs and 2021. Some of that decline may be due to reclassification of goods from China under new categories (which could violate U.S. Customs laws), and some is probably due to rerouting of goods that are partially or completely made in China but then “finished” in a third country before being sent to the U.S. Nevertheless, the net effect is that China is less important in U.S. imports than it was back in 2018. As we pointed out in an analysis in June, China has fallen from over 21% of U.S. imports to 16.5% last year. This year, China imports are running some 20% below last year’s levels. This further reduces the weight of post-tariff China import prices in the average price that Americans pay.
The issue therefore is not “who paid the tariffs?” but how did the tariffs impact the U.S. economy. The answer that emerges from the USITC study is that the Section 301 tariffs led to small but significant increases in production in the tariffed sectors, small price increases for the goods in those sectors purchased by Americans, and a diversification away from China sources, which is good news from a security and risk-avoidance perspective.
In conclusion, according to the USITC models, the Section 301 tariffs stimulated growth in U.S. production at 4.1%, which is greater than the price increases paid by U.S. buyers of 3.2%. Further, and more important, the price increases due to the tariffs should be one-time price increases, while the stimulus to production should carry on for multiple years. Once the Chinese goods are “handicapped” by tariffs in the U.S. market, this should enable U.S. producers to grow their domestic production, and with it jobs, revenue, and investment in the U.S., for multiple years. That’s why economists who recognize that production is more important than consumption support import restriction as a pro-growth tool designed to promote the growth of the U.S. manufacturing sector, and with it, more goods jobs and increased prosperity.
STEEL AND ALUMINUM TARIFFS: INCREASED INVESTMENT AND PRODUCTION, SMALL PRICEINCREASES
The Section 232 steel and aluminum tariffs are also covered in the USITC report. These tariffs were fundamentally different from the 301 China tariffs in that they were levied globally on all steel and aluminum imports (albeit with exceptions for certain nations, including Canada and Mexico). Nevertheless, we observe precisely the same trend: small increases in domestic production in both industries and price increases in the U.S. market far below the stated rate of tariffs. Table 3 shows that both steel and aluminum saw small but significant increases in production by 2021 as a result of the tariffs.
Table 3: Production changes in metals tariffed under Section 232. All data applies to 2021 and is from the USITC study.
| Industry | Change in quantity of domestic production 2021 | Change in value of domestic production 2021 |
| Steel | 1.9% | $1.33B |
| Aluminum | 2.9% | $0.92B |
| Notes: Change in production represents change vs. a counterfactual model in which there were no tariffs. | ||
| Source: USITC, Economic Impact of Section 232 and 301 Tariffs on U.S. Industries, Pub. No. 5405, May 2023 | ||
In the particular case of steel, the tariffs led to huge wave of new investments by U.S. steelmakers in new steelmaking and new steel mill facilities across the country. The USITC report included a table listing these new steel investments, some of them now producing steel, and some in the construction or planning stage. They add up to a stunning 21 million metric tons of additional steel capacity, roughly a 25% expansion of the U.S. industry.
Figure 1 Expansions in steel capacity since 2018 Section 232 tariffs total 21 million tons
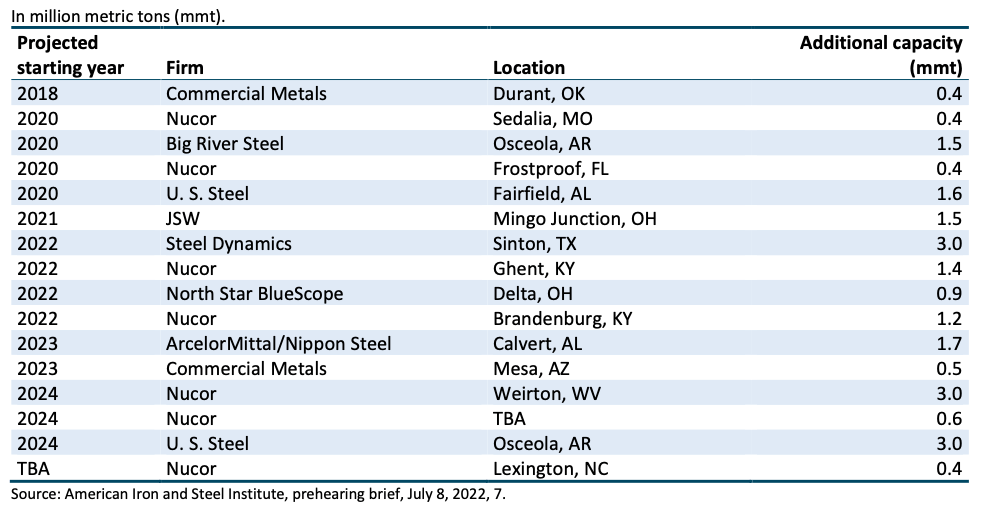
Source: USITC report, op. cit., pg. 93.
This is an overwhelming vote of support in U.S. steel tariffs by the U.S. steelmaking industry. That capacity expansion will probably lead to 20,000 new direct jobs, not including the construction jobs in building the new facilities and the indirect jobs in servicing and supporting the facilities after they open. Steel industry jobs are good, high-paying jobs, typically averaging around $100,000 a year plus benefits.
However, for mainstream economists this investment wave is a problem. Mainstream economists try hard to make their field resemble a natural science like physics (“physics envy” it is sometimes called), where every effect has a measurable cause. Thus the intense obsession with prices whenever tariffs are discussed. But the decisions by the seven firms listed in the above table were not prompted by any specific level of tariffs or of U.S. steel prices. In fact, as Table 4 below shows, U.S. steel prices rose a derisory 2.47% as a result of the tariffs. That is hardly a reason to build 20 million tons of capacity. Industry decisions in most U.S. industries are heavily influenced by expectations about the long-term future of the industry. The decisions to build so much additional capacity suggests that the senior executives at steelmakers took the view that the 25% Section 232 tariffs would provide several years of tailwind to the industry, and that the tailwind and the resultant economic growth in the industry would convince the politicians in Washington to continue to support the tariffs. The investment wave is also due to traditional competitive pressure, with each of the four leading U.S. steel firms believing they can win a competitive battle to lead the industry.
Table 4 shows the price impact of the Section 232 tariffs, which were set at 25% on covered steel imports and 10% on covered aluminum imports. In both cases, the price increases in the U.S. market were some 85%-90% below the headline rate of the tariff. In other words, by 2021, steel prices in the U.S. market were just 2.47% above where they would have been without tariffs. Aluminum prices were just 1.27% higher. The USITC report comments:
“Effects on prices of steel in the United States are small, in part because imported steel is a relatively small share of the total U.S. market, with U.S.-produced steel representing more than two-thirds of total consumption of steel.”[2]
Table 4: Price changes in steel and aluminum industries due to Section 232 tariffs. All data applies to 2021 and is from the USITC study.
| Industry | Producer price change of covered imports 2021 | Delivered price of covered steel imports 2021 | Change in average price in U.S. market 2021 |
| Steel | -1.81% | 22.74% | 2.47% |
| Aluminum | -1.91% | 7.90% | 1.27% |
| Notes: Change in prices represents change vs. a counterfactual model in which there were no tariffs. | |||
| Source: USITC, Economic Impact of Section 232 and 301 Tariffs on U.S. Industries, Pub. No. 5405, May 2023 | |||
In conclusion, the USITC study shows clearly that the Section 232 and 301 tariffs generated small but significant increases in U.S. production in all the industries examined. Those tariffs also generated small increases in prices in the U.S. market. If the tariffs had been more comprehensive they would have generated larger effects. Nevertheless, the production increases could be the beginning of a growth trend in domestic production, including of course U.S. jobs, revenue, profit, and investment. In the case of steel, they already are generating a multi-year, double-digit growth wave. In other industries, if it were more certain that the tariffs would remain in period for a long time to come, and be extended to more import sources and more industries, a greater and longer period of economic growth would follow.
NOTES
[1] Alberto Cavallo, Gita Gopinath, Brent Neiman, Jenny Tang, Tariff Passthrough at the Border and at the Store: Evidence from U.S. Trade Policy, Oct. 2019, pg. 3.
[2] USITC, op. cit., pg. 124.


