Key Points
- The Section 301 tariffs imposed in 2018 on Chinese imports reduced U.S. dependence on China. While U.S. imports surged by 39% between 2017 and 2022, China imports were up very slightly, and still below their 2018 peak. As a result, China fell from 21.6% of U.S. imports in 2017 to just 16.5% in 2022.
- The broad range of sectors where a significant share of U.S. imports have left China to locate in third countries highlights the low-tech, non-proprietary nature of most Chinese manufacturing. After the imposition of Section 301 tariffs, China lost share in 16 of 19 manufacturing sub-sectors.
- The continued collapse in China’s share of U.S. imports highlights the fact that decoupling is a viable objective, and has in fact already begun.
- Mexico, Vietnam, and Cambodia gained most from China’s falling share. Mexican imports rose by $111 billion since 2017, while Vietnam imports have more than doubled from a low base, and Cambodia’s have more than tripled.
- The Section 301 tariffs also led to some reshoring to the U.S. A recent USITC report found several sectors, such as semiconductors, reshored some production due to the tariffs.
Section 301 Tariffs Led to Trade Diversion from China to Elsewhere in Asia and Mexico
In 2018, the U.S. imposed Section 301 tariffs on about $250 billion of Chinese imports. As a result of the tariffs, trade diverted to other countries as firms shifted production out of China. Trade diversion refers to the shifting source of imports from one country to others as the result of an increase in tariff rates.
In 2018, the U.S. imported $538.5 billion of goods from China. Last year, the U.S. imported $536.3 billion from China, a decline of 0.4% since the tariffs were imposed — despite an increase of 28% in total goods imports over the four years from 2018 to 2022. So far this year, U.S. imports from China are running about 15% below the 2022 level, suggesting that China’s share is likely to shrink further. Having invested in new or expanded facilities in Southeast Asia, Mexico, and India, U.S. and international companies are now moving to volume production in those locations, reducing China’s share of the U.S. market.
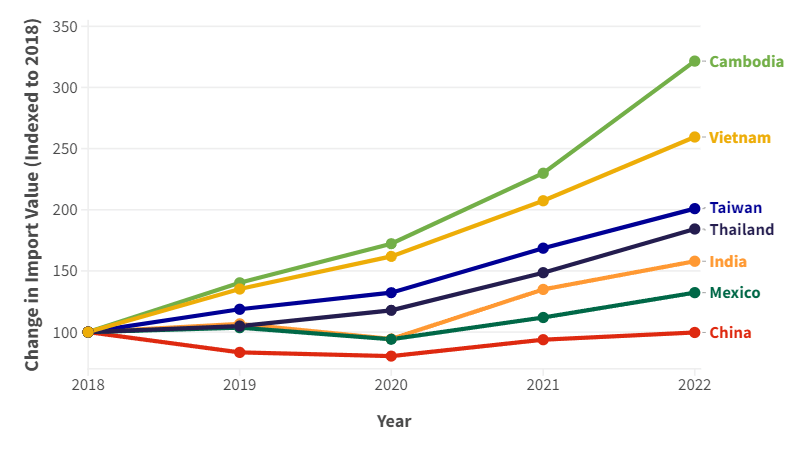
Figure 1 shows the growth of U.S. import value by country since 2018. The Section 301 tariffs were imposed in 2018 and 2019 and have never affected more than half of U.S. imports from China. As a share of U.S. imports, Cambodia and Vietnam gained most from the tariffs. Goods requiring labor intensive production such as a apparel, leather products, and furniture shifted to these countries. Since 2018, Cambodia’s import value to the U.S. has more than tripled. The value of imports from Vietnam nearly tripled as the country now ranks as the 6th largest source of U.S. imports, up from 12th in 2018.
In many cases, the components or parts still come from China, and ownership of the manufacturing businesses may be Chinese, American, or elsewhere. Nevertheless, the industrialization process is underway in these countries, which augurs badly for China. Of course, the U.S., with $3.27 trillion of goods imports last year, still imports far too much. Domestic policy solutions made by the U.S. will be necessary to reduce our imports and shrink the trade deficit.
Figure 1: Import Value by Country (2018-2022) (Indexed to 2018)
Source: U.S. Census Bureau; CPA Calculations
Table 1 shows the countries that gained the greatest share of U.S. import value from 2017 to 2022. Since the Section 301 tariffs were imposed, the share of imports from China has steadily declined from 21.6% in 2017 the year prior to the tariffs to 16.5%, a decline of 5.1%. No other country has lost as much share of total U.S. import penetration over the past five years.
In terms of total import value, Mexico gained the most from the tariffs, adding $110.8 billion. Vietnam gained the second most in import value by $78.4 billion and by far gained the most of total share of U.S. imports. In 2017, Vietnam accounted for about 2% of U.S. imports at $46.5 billion. In 2022, the U.S. imported $127.5 billion in goods from Vietnam, and the share of the total nearly doubled to 3.9%. Other countries in Southeast Asia such as Thailand, Cambodia, and Indonesia all saw significant increases in their value of imports by the U.S.
Table 1: Change in Share and Value of U.S. Imports by Country
| Country | Change in Share | Share of Total U.S. Imports (2022) | Change in Import Value since 2018 ($, Billions) | 2022 Import Value ($, Billions) |
| China | -5.1% | 16.5% | -$1.8 | $536.7 |
| Vietnam | +1.9% | 3.9% | +$78.4 | $127.5 |
| Taiwan | +1.0% | 2.8% | +$46.1 | $91.8 |
| Mexico | +0.6% | 14.0% | +$110.8 | $455.0 |
| India | +0.6% | 2.6% | +$31.4 | $85.7 |
| South Korea | +0.5% | 3.6% | +$41.1 | $115.3 |
| Thailand | +0.5% | 1.8% | +$26.9 | $58.7 |
| Cambodia | +0.2% | 0.4% | +$8.4 | $12.2 |
| Indonesia | +0.2% | 1.1% | +$13.7 | $34.6 |
| Singapore | +0.1% | 1.0% | +$5.1 | $31.6 |
| Bangladesh | +0.1% | 0.3% | +$5.1 | $11.2 |
| Malaysia | +0.1% | 1.7% | +$15.4 | $54.8 |
Source: U.S. Census Bureau; CPA Calculations
Table 2 shows the change of U.S. import share and value in all 19 manufacturing subsectors for China since 2018. China has lost share in 16 of the 19 manufacturing subsectors. It primarily lost share among goods that are labor intensive such as furniture, leather products, and apparel and footwear. China also lost significant share in the computer/electronics subsector, which was driven largely by a 16% loss of U.S. import share in semiconductors (NAIC 3344).
It is significant that China added value in transportation, a sector that includes electric vehicles and aerospace. For more than a decade, China has targeted the EV market and is building global brand names like Polestar and BYD. Similarly in aerospace, China’s COMAC recently launched the C919, a passenger jet to compete with Boeing and Airbus. China will be a world-class competitor in both of these industries. But in many other sectors, it has gained through low wages, intellectual property theft, and U.S. negligence of its own manufacturing capabilities.
Table 2: Change in Import Value from China by Manufacturing Subsector
| Subsector | Change in Import Share | Change in Import Value ($, Billions) |
| Furniture | -23% | -$5.1 |
| Leather | -19% | -$3.1 |
| Computer / Electronics | -14% | -$23.2 |
| Apparel | -12% | -$5.7 |
| Textiles & Fabrics | -11% | -$0.6 |
| Wood | -11% | -$1.1 |
| Electrical Equipment | -9% | $11.9 |
| Nonmetallic Minerals | -8% | $0.6 |
| Printed Products | -7% | $0.2 |
| Textile Mill Products | -5% | $2.2 |
| Machinery | -4% | $3.6 |
| Plastics & Rubber | -4% | $5.7 |
| Paper | -4% | $0.4 |
| Fabricated Metals | -3% | $7.1 |
| Food | -3% | -$0.07 |
| Primary Metals | -2% | $0.2 |
| Transportation | 0% | $1.9 |
| Miscellaneous Manufacturing | 0% | $18.2 |
| Chemicals | 1% | $16.8 |
Source: U.S. Census Bureau; CPA Calculations
U.S. Not Dependent on Chinese Imports
The impact of the Section 301 tariffs on trade flows suggests that manufacturing investment will quickly relocate and the goods that today come from China will quickly come from other sources. The pressures to do this are both geopolitical and economic. Global manufacturing industry believes that the U.S. government wishes to distance itself from China. Economically, with China’s rising wages in recent years, other nations now can offer lower labor costs.
Economists typically argue trade diversion is welfare-decreasing (i.e. reduces GDP) because production shifts to higher cost suppliers. However, there is little evidence this occurred in the case of the Section 301 tariffs. Studies have pointed out that there was little to no consumer inflation due to the tariffs. Furthermore, economists’ models assume an existing equilibrium state in which production already exists in its most optimal, lowest-cost location. In reality, many of the new sources of U.S. imports have lower labor costs than China. Once the initial capital investment costs are done, the unit costs for the sorts of consumer goods where production shifted likely are the same or even lower.
These conclusions were endorsed by the U.S. International Trade Commission in a recent report. In March 2023, the USITC report on the Section 301 tariffs found that “for every 1 percent increase in these tariffs, imports from China of products covered by the tariffs have decreased by about 2 percent in value and quantity.” The report also noted that this effect became stronger over time as firms relocated production elsewhere.
Tariffs can also function to reshore foreign production to the U.S. The ITC report also found that the value of domestic production increased in sectors where import value from China was the highest. Notably, the value of U.S. semiconductor production increased by 6.4% as a result of the tariffs according to their model.
As Congress considers policies to further decouple from China, including removing its Most Favored Nation (MFN) status, it should consider the evidence of what actually happened from the Section 301 tariffs. Consumer goods did not increase in price due to the tariffs, the supply chain diversified as production shifted from China, and there was some increase in domestic production.