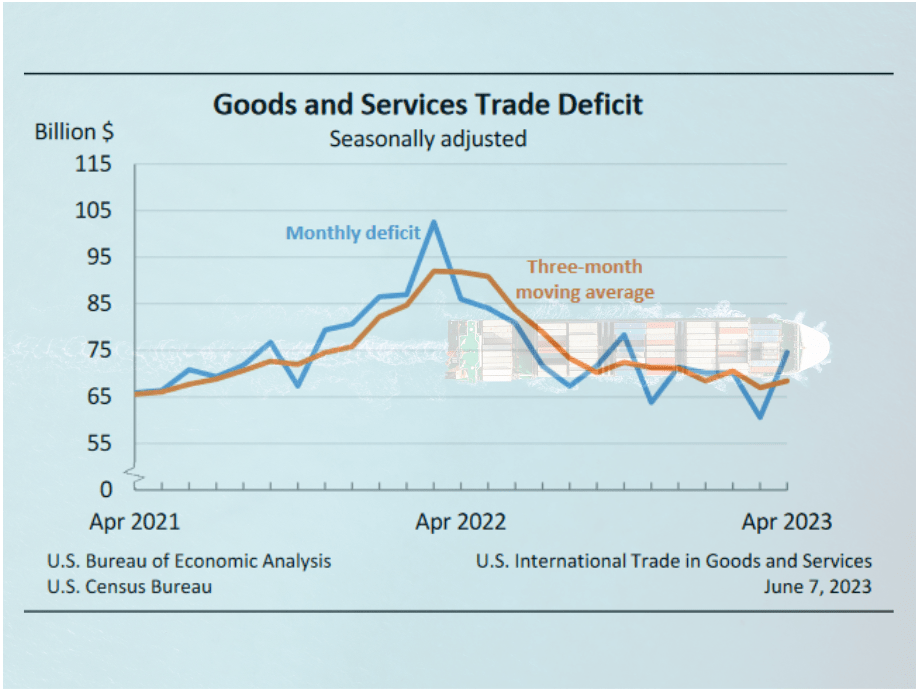
The U.S. trade deficit rose 23% in April to $74.6 billion with April being the import surge month of the year so far.
Imports rose by $4.8 billion to $323.6 billion in April, while U.S. exports to the world fell by $9.2 billion from March levels to hit $249 billion in April. This rise in imports is unlikely because of a strong dollar. The dollar index has remained relatively flat in April. Dollar strength returned in May, suggesting this coming summer’s trade gap is likely to rise as it is less costly to buy foreign goods with a stronger dollar.
The dollar tends to affect trade with a 12-36 month lag so you shouldn’t really look at this month’s moves in the dollar and monthly trade. A 15% rise in the dollar between mid-2021 and end-2022 has contributed to rising imports.
See the CPA Trade Database for updated monthly and annual figures.
Worth noting, however, the Jan-Apr deficit is higher than it was in the first four months of 2021, when the goods and trade deficit was $259.04 billion, the Bureau of Economic Analysis reported on Wednesday.
Stronger imports and lackluster exports for the month of April weighed on the goods trade. The U.S. goods deficit came in at its highest level for the year at $96.11 billion. The March revised number is $81.58 billion. The last time the U.S. cracked $96 billion was in Oct. 2022.
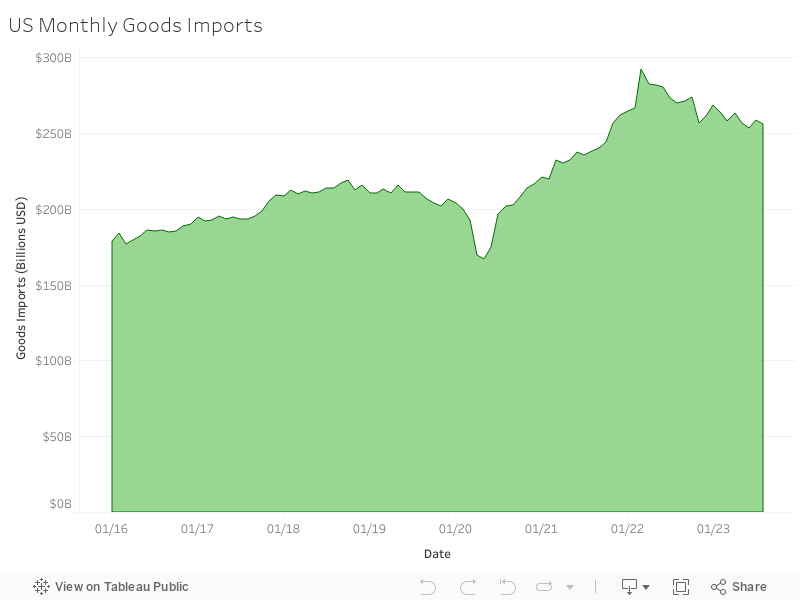
With April being the record-breaking month for 2023’s goods trade gap with the world, the U.S. goods deficit is now at $359.25 billion. This is much lower than the $439.04 billion registered in the Jan-Apr 2022 period ($439.04 billion), but higher than the Jan-Apr 2021 period ($347.42 billion). The U.S. is importing less from China. BEA data provides more evidence of a shift away from mainland China’s supply chains. The April deficit was $20.28 billion versus $16.6 billion in March, but those numbers were much higher last year. The April 2022 goods gap with China was $30.40 billion. For this year, the goods deficit with China is down by over $40 billion to $81.05 billion versus a $131.09 billion gap in the Jan-Apr 2022 period.
“The $50 billion drop in our goods trade deficit with China in the first four months of this year from last year shows that the Section 301 China tariffs are working and decoupling is becoming a reality,” said CPA chief economist Jeff Ferry. “It will take strategic thinking and further policy measures to continue the process, but we are on the right track towards reducing dependence on China and rebuilding US industrial capacity.”
The full U.S. trade deficit – which includes trade in services such as travel and software licensing fees – dropped 23.9% to $275.54 billion between January and April.
Top Five Imports
| April 2023 | March 2023 | Year-to-Date 2023 | YTD 2022 | |
| Pharmaceuticals | $16.94 b | $17.12 b | $67.49 b | $61.44 b |
| Passenger Cars | $15.93 b | $15.09 b | $62.47 b | $53.65 b |
| Automotive parts | $11.88 b | $10.92 b | $45.89 b | $47.78 b |
| Cell phones | $10.51 b | $8.83 b | $42.01 b | $48.06 b |
| Electronic apparatus | $7.91 b | $7.64 b | $32.74 b | $27.82 b |
The goods trade is generally the same five items going across borders, led by pharma and automotive. Each one, however, is always in a deficit though this does not mean that the U.S. is more reliant on car imports than domestic manufacturing. Most of the cars made here are sold here.
Top Five Exports
| April 2023 | March 2023 | YTD 2023 | YTD 2022 | |
| Pharmaceuticals | $8.64 b | $9.51 b | $35.67 b | $27.82 b |
| Industrial machines | $5.71 b | $5.48 b | $22.86 b | $23.90 b |
| Automotive parts | $5.28 b | $5.08 b | $20.67 b | $18.27 b |
| Passenger cars | $4.63 b | $4.85 b | $19.81 b | $17.67 b |
| Civilian aircraft engines | $4.56 b | $4.21 b | $16.96 b | $13.74 b |
America’s Biggest Deficits
Even though China’s imports are declining due to tariffs, sanctions, and domestic incentives to produce items that were once sourced from China, the world’s No. 2 economy is still the biggest source of our trade deficit with the world. The steep fall in imports from China in these four months suggests that U.S. policies to “decouple” from China are working, and also that the post-pandemic catch-up, when consumers bought goods that were previously unavailable, ended around the end of 2022.
Here’s a look at our top five biggest trade gaps so far this year:
| April 2023 | YTD 2023 | YTD 2022 | |
| China | $20.28 b | $81.05 b | $131.09 b |
| Mexico | $13.35 b | $47.68 b | $42.30 b |
| Vietnam | $7.77 b | $31.05 b | $36.55 b |
| Germany | $7.43 b | $27.42 b | $20.66 b |
| Japan | $7.03 b | $23.27 b | $23.45 b |
The deficit with the EU was $16.31 billion in April, up from $15.86 billion in March and hitting $62.65 billion on the year.
Once again, the U.S. trade gap in advanced technology products is back on the rise. The April deficit was $14.95 billion, up from $14.31 billion in March, but down from the first two months of the year. However, while known as an advanced tech powerhouse, the U.S. trade deficit in these products is $61.85 billion. That is down from last year by around $12 billion but is up by roughly $5 billion from 2021. Our biggest deficit nation for these technologies is China, which is a leader in 5G and other telecommunications technology equipment manufacturing, based on BEA data.