
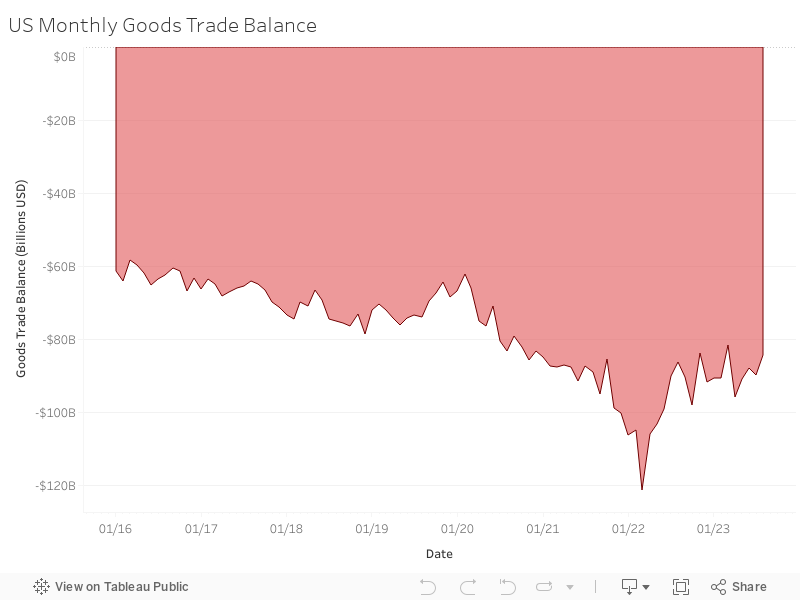
The U.S. goods and services trade deficit rose by 2.7% in February to $70.2 billion, even as both exports and imports fell on the month, the Bureau of Economic Analysis said on Wednesday. Exports fell more, leading to the rising gap between the two. But over the last two months, when only goods are considered and not the services trade, the U.S. economy recorded a $92.9 billion deficit in February, second only to the $106.3 billion deficit in February 2022, a record-breaker. All told, the goods deficit for the first two months of 2023 is $183.24 billion.
Wednesday’s trade numbers suggest the U.S. economy may be cooling somewhat. The goods deficit is smaller than it was in the first two months of 2022, when it stood at $214.23 billion, helping propel the U.S. into a record $1.19 trillion deficit last year.
All told, the year-to-date goods and services trade deficit decreased $35.5 billion, or 20.3%, from the same period last year. Exports of goods and services increased $49.5 billion or 10.8% while imports increased by $14 billion or 2.2%. The average goods and services deficit increased $3.3 billion to $68.8 billion for the last three months ending in February. Services include things like travel and tourism, intellectual property fees, and financial services.
The U.S. trade balance without petroleum products came in at a $92.123 billion deficit in February, which was not as high as the $102.7 billion deficit in February 2022. Commodity exports led by oil and gas and soybeans help keep the trade deficit from rising faster. Last year’s petroleum surplus of $14.1 billion made the goods trade deficit look slightly better than the underlying deficit in manufacturing trade, which continues to worsen.
Worth noting, February was a strong month for the dollar. The dollar index began February at 118.6 and ended the month at 121.4. For the index, 100 represents the dollar value against a broad set of other currencies. A rising index means the dollar is strengthening against other currencies, such as the euro and yen; a falling index means the dollar is becoming more competitive, benefiting industry and farmers. (See CPA’s new Currency Misalignment Monitor, which weighs the U.S. dollar’s performance versus other key currencies responsible for our trade imbalances.)
If the U.S. trade deficit remains at this pace, the U.S. will not breach last year’s record-breaking numbers but will come closer to 2021’s figures of $1.09 trillion. Either way, trillion-dollar goods deficits will be the trend barring a shift in U.S. consumption. Or a dollar index in the low 90s.
“Trillion-dollar goods deficits represent a huge loss of demand and business for U.S. manufacturers and farmers,” said CPA chief economist Jeff Ferry. “One of the drivers of ever-higher government spending is the need for government spending to make up for the lack of domestic demand due to high and growing levels of imports. It would be much easier to cut the federal deficit and live within the debt ceiling if U.S. producers and workers, not importers, were meeting more of the demand from U.S. consumers.”
See CPA’s Monthly Trade Database for updated figures.
 Biggest Deficit Countries
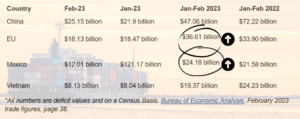
China is still the main source of the U.S. trade deficit. But rich Europe is not far behind.
Overall, February trade figures showed surpluses, in billions of dollars, with South and Central America ($4.7), Hong Kong ($2.5), Netherlands ($1.8), Belgium ($1.6), Australia ($1.5), Brazil ($0.9), United Kingdom ($0.5), and Singapore ($0.2). While deficits were recorded with the usual suspects: China ($25.2), European Union ($18.1), Mexico ($12.0), Vietnam ($8.1), Japan ($5.7), Canada ($5.6), Taiwan ($4.7), South Korea ($4.5), Ireland ($3.7), India ($3.7), Malaysia ($2.8), Saudi Arabia ($0.7) and Israel ($0.6), which is a big pharmaceuticals exporter to the U.S.
Vietnam has become an important outpost for Chinese companies. But many U.S., Japanese and European companies have moved there thanks, as well, to massive currency misalignment. One U.S. dollar is equal to 23,465 VNDs. The average monthly salary for manufacturing labor in Vietnam was around VND 7.6 million (approximately $330 per month) in the fourth quarter of 2020, according to data from the General Statistics Office of Vietnam. European toymaker Lego is building a new factory there, slated for opening next year.
Vietnam is becoming the new China.
Some key socio-economic indicators for Vietnam in 2022 include gross domestic product growth of 8.02%; industrial production up 7.8%, with an inflation rate below that of the U.S. at just 2.59% as of the end of December.
Vietnam is our fourth largest deficit. Near-term, the U.S. trade balance has shifted away from Asia and towards “allies” – namely EU and Mexico, both of which are seeing bigger trade gaps so far this year.
Trade Curiosities
The U.S. top exports and imports are similar month to month, led by pharmaceutical goods, industrial equipment, auto parts, passenger vehicles, semiconductors, and cell phones. The U.S. maintains a surplus in industrial equipment exports and semiconductors but has a gaping deficit in the other items.
Here is a look at some interesting data points regarded other goods.
- The U.S. exported $98.05 billion worth of manufactured goods in February but imported $198.10 billion. In the first two months of 2023, U.S. companies spent $417.45 billion on imported manufactured goods, up from $414.39 billion spent in the first two months of 2022. (page 31, BEA Feb. trade full release with tables)
- We like to think of the U.S. as a world leader in advanced technologies, but we are mostly a leader in the invention of those products, not their manufacturing. We collect the intellectual property fees (part of the service economy trade surplus) and outsource the manufacturing. For the month of February, the U.S. deficit of advanced technology hit a two-year high of $16.23 billion. For the first two months of 2023, the U.S. deficit in advanced technology manufactured goods was $32.58 billion, which is similar to the $32.54 billion in 2022, but higher than the $27.89 billion in 2021. (page 33, BEA release)
- Within the advanced technologies sector, the biggest product sectors in which the U.S. has high deficits with the world are led by Information and Communications Technologies ($27.28 billion deficit YTD); Biotech ($6.42 billion deficit YTD) and Optical-Electronics Equipment ($4.7 billion deficit YTD). The top three sources of those materials are China, Taiwan, and Mexico. (page 34, BEA release)
- America’s agricultural trade is more in balance than it is in surplus. The U.S. exported $15.25 billion worth of agricultural commodities in February but imported $15.29 billion. For the first two months of the year, the U.S. exported $32.28 billion and imported $32.40 billion of agricultural commodities. (page 31, BEA)
- The U.S. imports more fish and shellfish than it exports. In February, the U.S. sold $474 million worth of fish and shellfish to world markets and imported $2.15 billion worth due to much tighter regulations and phytosanitary standards than the Asian imports face. (page 20, 22 BEA)