The overall U.S. trade deficit saw its biggest monthly decline in July, dropping 12.6% with imports falling by 2.6% in what may be a sign of things to come, based on trade figures published Wednesday by the Bureau of Economic Analysis. If the U.S. economy is indeed slowing down, then there is a chance that the trade deficit growth will moderate. However, there is the likelihood that July’s decline is due to big importers holding off on new purchases after stocking up in the late spring and early summer over supply chain concerns and that imports surge once again as we approach the holiday season.
“Going forward, I think the monthly trade gap will start to shrink a bit since July consumer spending data showed a slowdown, which is confirmed by major retail chains saying they are overstocked with inventory now,” said Jeff Ferry, chief economist for CPA.
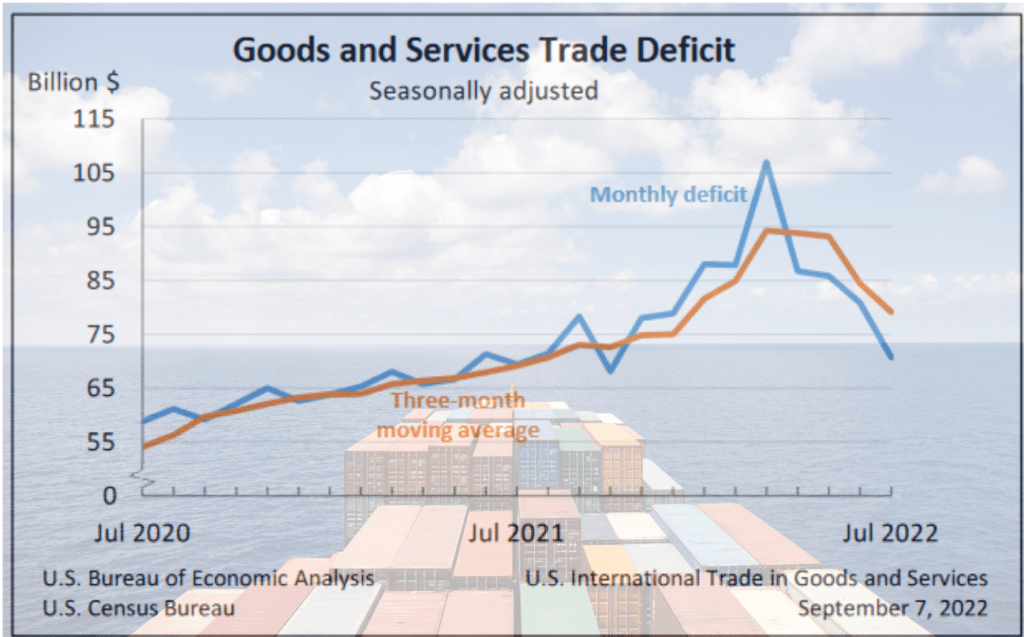
July imports fell 2.6% to $329.9 billion while exports rose 0.2% to $259.3 billion, making for a monthly goods and services deficit of $70.6 billion. This was the lowest recorded monthly trade deficit figure of the year. However, year-to-date, the goods and services deficit increased by $136.6 billion, or 29%, from the same period in 2021 reflecting an increase of $286.4 billion or 19% for exports and a $423 billion or 22.1% rise in imported goods and services.
See CPA’s trade database for directional trends.
On the goods side of the equation, July recorded a $91.09 billion deficit, the lowest of the year. The goods deficit this year is $743.29 billion, up from $620.4 billion over the same period in 2021.
If the U.S. maintains a $90 billion deficit for each of the remaining months, the full year goods trade gap with the rest of the world will be $1.19 trillion, up from $1.09 trillion last year.
Where the Deficits Are
Trade deficits were recorded with the usual countries for July with China accounting for more than the EU, Mexico and Vietnam combined. And much of the imports from Vietnam are from Chinese multinationals, such as solar panels and furniture.
Deficits were recorded with China ($33 billion), the EU ($11.9 billion), Mexico ($11.7 billion), Vietnam ($10 billion), Canada ($8.7 billion), Japan ($5.5 billion), Germany ($5.1 billion) and many others.
However, with the slowdown overall in imports, deficits did decline in the biggest markets.
- The deficit with the European Union decreased $5.7 billion to $11.9 billion in July. Exports increased $1.7 billion to $31.4 billion and imports decreased $4.0 billion to $43.3 billion.
- The deficit with China decreased $3.9 billion to $33.0 billion in July. Exports increased $0.9 billion to $12.8 billion and imports decreased $3.0 billion to $45.8 billion.
- The deficit with Mexico increased $2 billion to $11.7 billion in July. Exports decreased $0.2 billion to $27.6 billion and imports increased $1.8 billion to $39.3 billion.
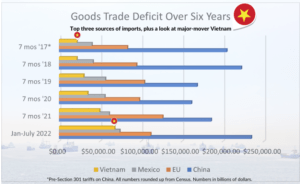
A look at the direction of the trade deficit with key markets. While this is dollar values and not volume, one major standout is Vietnam. The tiny SE Asian nation has become a reliable outpost for transshipment and new corporate investment, primarily from China. The U.S. deficit with China over the last seven months is similar to 2018, when the Section 301 tariffs were imposed.
Currency is also a headwind.
Over the last few months, the U.S. dollar has strengthened against all of the major currencies. The dollar has gained massively against the Japanese yen, up 25.8% year-to-date. The euro is in free fall due to inflation and stimulus spending to shore of energy price increases there. The dollar has gained over 14% against the euro so far this year and gained 9.3% against the Chinese renminbi. This alone could lead to strong imports even if the economy is slowing.
The stronger dollar not only makes imports more attractive due to pricing, but it also entices companies looking to invest overseas to do so now that their capital goes a lot farther in Europe, China, and Mexico than it does here.
“With both our goods deficit and goods & services deficit headed for figures in excess of a trillion dollars, and the dollar’s foreign exchange value continuing to rise, Congress and the administration must wake up to the deep imbalances in the global economy and their intense pressure on U.S. industry and high-quality jobs,” said Ferry.
Top 5 July Exports
The top traded items remain relatively similar month over month for both imports and exports, with industrial machinery or semiconductors sometimes trading spaces in the top five. Here’s the recent trend compared to a month ago and year-to-date increases or decreases. Year-to-date (YTD) refers to the sum of January through July figures for 2022 compared to the same period in 2021.
Item July 2022 June 2022 YTD Change
Pharmaceuticals $7.05 billion $7.72 billion +$9.95 billion
Industrial machinery $6.48 billion $5.92 billion +$3.46 billion
Semiconductors $5.57 billion $5.53 billion +$582 million
Passenger cars $5.44 billion $4.46 billion -$183 million
Car parts $4.42 billion $4.17 billion +$4.05 billion
Top 5 July Imports
Cross-border trade is quite similar, with pharmaceutical inputs often being used to make finished drugs at home. The same goes for car parts. Good luck finding an American-made cellphone.
Item July 2022 June 2022 YTD Change
Pharmaceuticals $13.06 billion $16.06 billion +$9.33 billion
Passenger cars $12.66 billion $12.05 billion +$3.31 billion
Car parts $11.65 billion $10.98 billion +$9.4 billion
Cell phones $11.44 billion $12.06 billion +$16.15 billion
Computers $9.25 billion $8.82 billion +$4.60 billion