


Key Points
- U.S. pharmaceutical imports have skyrocketed in the last ten years, with imports from China, India and Mexico leading the surge.
- India and China are increasingly the leading U.S. source for generic pharmaceuticals, which account for 90% of all prescriptions written in the U.S.
- In 2021, China was the leading source for U.S. pharmaceutical imports measured by weight, accounting for 190 million kilograms (418 million lbs) or 23% of total pharma imports.
- Growing U.S. dependence on China and India for widely-used generic pharmaceuticals creates serious risks to national security and patient safety. China now accounts for 95 percent of imports of ibuprofen, 91 percent of imports of hydrocortisone, 70 percent of imports of acetaminophen, and 40 to 45 percent of imports of penicillin.
- China’s and India’s dominance of the U.S. generic pharmaceutical supply chain is growing. These two countries account for 85% of filings for new active pharmaceutical ingredients, according to data from an industry watchdog.
- Driven by rising prices and increased import volumes, pharmaceutical imports are likely to finish 2022 at around $196 billion, the second-largest U.S goods import, just behind automotive. For 2021, the U.S. deficit in pharmaceutical trade was $96.2 billion.
- Federal policy can turn around the offshoring of pharmaceutical production and our reliance on India and China. Tax credits for domestic production and other policies are under consideration in Congress and the Biden administration.
Pharmaceuticals have become the second largest manufactured import into the U.S. amounting to $176 billion in imported goods in 2021, and a large driver of the trade deficit. Furthermore, India and China have increased their dominance of generic drug production. According to data from an independent nonprofit, those two nations now account for 85% of worldwide filings for new active pharmaceutical ingredients. Those filings are primarily for generic pharmaceuticals, and represent increasing U.S. reliance on India and China for many vital generic drugs. China, India, and Mexico accounted for 57% of all pharmaceutical imports by weight in 2021.
Total Pharmaceutical Imports Hit New Highs in 2020, 2021, and 2022
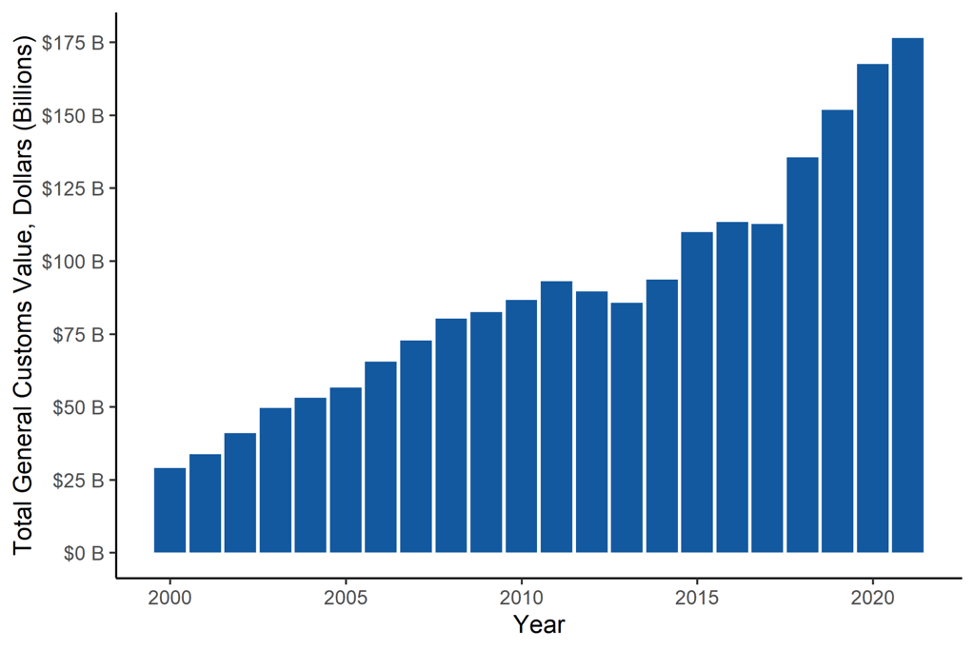
Over the past decade to 2021, pharmaceutical imports have nearly doubled (increased by 89%) and increased by a factor of six in the past twenty years. Pharmaceutical imports have increased substantially more than total imports over the same period, driven by increased U.S. spending on health care, higher drug prices, and the persistent offshoring of drug manufacturing by leading pharmaceutical multinationals. Over the past twenty years, pharmaceuticals went from the ninth most imported good to second only to automotive. Through November 2022, pharmaceutical imports were running 11.5% ahead of their total in 2021, and likely to finish the year at around $196 billion.
In light of the seemingly unstoppable growth of health care spending in the U.S., pharmaceutical imports are very likely to overtake automobiles within the next few years. Along with growing imports, drug shortages and a lack of regulation over drug safety have emerged as production of pharmaceuticals and the key ingredients necessary to manufacture medicine have become increasingly concentrated in China and India.
FIGURE 1: U.S. Pharmaceutical Imports (2000-2021)
Most finished pharmaceutical products in terms of imported value come from other industrialized countries. As measured by general customs value, Ireland is the largest pharmaceutical country of origin, accounting for 24% of U.S. pharmaceutical imports. For decades, Ireland has used a low corporate tax rate, company-specific tax breaks, and other government subsidies to lure U.S. pharmaceutical companies to set up production there. Germany and Switzerland round out the top three accounting for 13% and 12% of U.S. pharmaceutical imports, respectively. The top ten countries of origin account for about 80% of the total share of finished pharmaceutical products imported to the U.S.
TABLE 1: Value of Pharmaceutical Imports to the U.S. by Country of Origin (2021)
| Country of Origin | Import Value, 2021 ($) | Percent of Total |
| Ireland | $42.3 billion | 24.0% |
| Germany | $22.8 billion | 12.9% |
| Switzerland | $21.6 billion | 12.2% |
| India | $9.7 billion | 5.5% |
| Singapore | $8.7 billion | 4.9% |
| Belgium | $8.0 billion | 4.5% |
| United Kingdom | $7.5 billion | 4.3% |
| Denmark | $6.8 billion | 3.9% |
| Italy | $6.4 billion | 3.6% |
| Japan | $6.3 billion | 3.6% |
Source: U.S. Census Bureau (NAICS Code 3254 – Pharmaceuticals & Medicines)
Like many developed countries, the U.S. is also a major pharmaceutical exporter. Pharmaceuticals ranked third among top goods that the U.S. exports to the rest of the world. Last year, pharmaceutical exports totaled $80.1 billion. Our imports were more than twice the value of our exports and we had a trade deficit in pharmaceuticals of $96.2 billion.
Drugs produced in the U.S. and exported are typically higher value branded drugs sold at high prices often based on cutting-edge technology. In contrast, imports are typically generic medications that are off-patent or off-exclusivity. U.S. companies lack the same incentives to produce such lower cost drugs domestically. Different drugs are not substitutes for each other.
This has implications for the supply of pharmaceuticals that Americans most frequently consume. According to the Food & Drug Administration, 90% of all prescriptions are for generic medications. However, generics account for just 18% of prescription drug expenditures. As Table 2 shows, in terms of weight, 57% of pharmaceuticals to the U.S. are imported from China, India, and Mexico.
TABLE 2: Quantity of Pharmaceutical Imports to the U.S. by Country of Origin (2021)
| Country of Origin | Quantity (kilograms) | Percent of Total |
| China | 190,925,360 | 23.6% |
| Mexico | 149,587,712 | 18.5% |
| India | 117,611,862 | 14.5% |
| Canada | 71,296,029 | 8.8% |
| Germany | 44,277,775 | 5.5% |
| Italy | 34,732,949 | 4.3% |
| Ireland | 19,000,939 | 2.4% |
| Switzerland | 18,006,360 | 2.2% |
| United Kingdon | 17,111,917 | 2.1% |
| France | 15,924,347 | 2.0% |
Source: U.S. Census Bureau (NAICS Code 3254 – Pharmaceuticals & Medicines)
Considering the value and volume of global pharmaceutical production, the developed world largely manufactures branded drugs that are highly profitable while generic drugs upon which Americans rely on for standard prescriptions like antibiotics are predominately sourced from poor countries where production costs are low and regulatory standards are poor and sometimes nonexistent.
Imports from India and China Surging
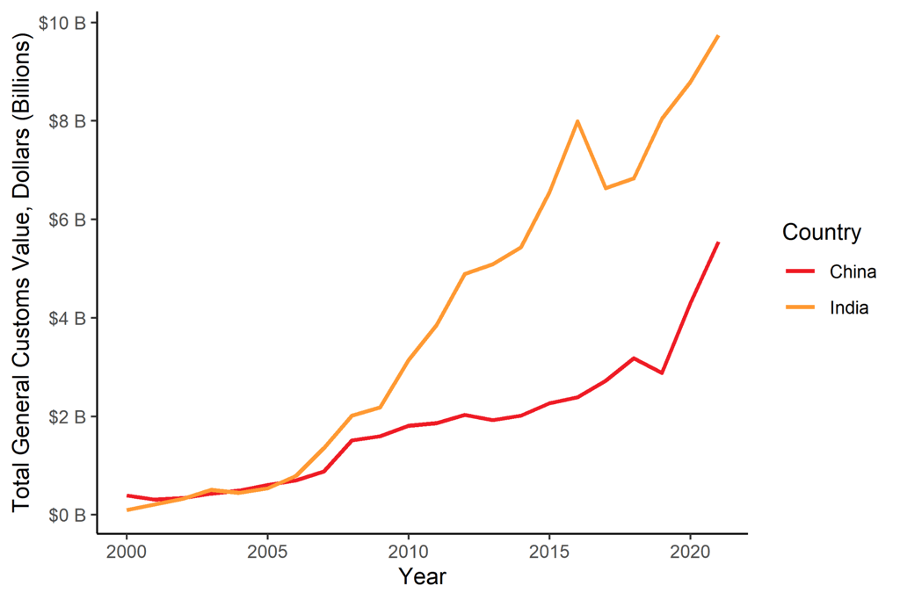
Both India and China have massively increased both the value and volume of pharmaceuticals that the U.S. imports in recent years. Pharmaceutical imports by value from India have risen by a factor of 46 in just 20 years. India is currently the fourth largest exporter of pharmaceuticals to the U.S. at about $9.7 billion in value of goods, accounting for about 6% of U.S. pharmaceutical imports. Yet, just two decades ago, India exported only $209 million of pharmaceuticals to the U.S. Likewise, China has also increased its share over recent years. In 2021, the U.S. imported $5.5 billion worth of pharmaceuticals from China, more than double the amount from just five years earlier.
The offshoring of the manufacturing of generic drugs has led to a growth in their production by state subsidized companies in China and India that lack the same regulatory oversight that drugs produced in the U.S. face.
FIGURE 2: Quantity of U.S. Pharmaceutical Imports from China and India (2000-2021)
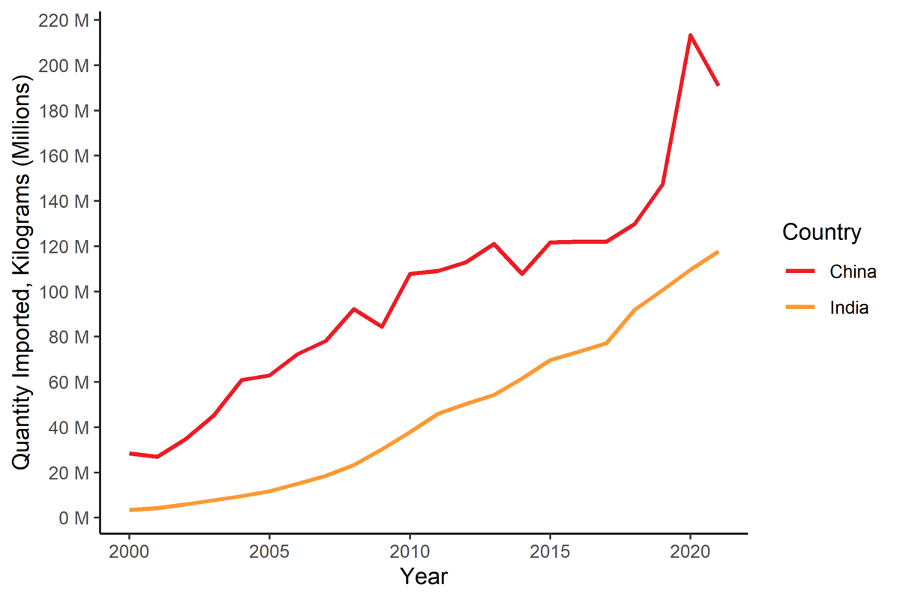
FIGURE 3: Value of U.S. Pharmaceutical Imports from China and India (2000-2021)
This shift in the production of generic pharmaceuticals has had consequences for the resilience of the supply chain. USP, a non-profit research organization that advocates for patient safety by ensuring high pharmaceutical quality, analyzed the evolution of the supply chain in Active Pharmaceutical Ingredients (APIs). APIs are the essential building blocks for all pharmaceutical products. USP mined Drug Master Files (DMFs) filed by pharmaceutical companies with the U.S. Food & Drug Administration and non-U.S. regulatory agencies to determine the country of origin of APIs. In 2000, China and India combined accounted for about a quarter of the global share of API filings. By 2021, India accounted for 62% of active filings and China accounted for 23% of active filings, a combined 85% of the global share of active API filings. The analysis shows an increasing concentration and supply chain reliance on China and India for key inputs to critical medicines.
China’s Upstream Strategy
Further upstream in the production of pharmaceuticals are the necessary chemicals and plants needed to make APIs. Despite accounting for only about 3% of finished pharmaceuticals imported into the U.S., China controls the production of key starting materials (KSMs) that are the initial ingredients in the production of pharmaceuticals. Even India relies heavily on China for sourcing its raw materials. The U.S.-China Economic and Security Review Commission reported that India sources 80% of raw materials for its pharmaceutical production from China.
As a result of increasingly concentrated pharmaceutical production, many of the medications that millions of Americans rely upon come from a single source. According to the U.S. Department of Commerce, China now accounts for 95 percent of imports of ibuprofen, 91 percent of imports of hydrocortisone, 70 percent of imports of acetaminophen, 40 to 45 percent of imports of penicillin, and 40 percent of imports of heparin. Overall, 80 percent of the U.S. supply of antibiotics are made in China.
China’s chokehold on the raw materials necessary for the production of pharmaceuticals and its recently increasing output of finished pharmaceuticals is a pattern it has commonly replicated in other industries. First, China controls the process of production of raw materials necessary for a given industry. Once it has dominated the upstream production, it then subsidizes companies downstream that produce the finished product by far undercutting the cost of production for existing companies through cheap labor and large state subsidies.
The result is a lack of supply chain resilience and a growing concentration within the pharmaceutical industry. The dependence on a single supplier upstream of KSMs and APIs leads to shortages downstream in the finished product. Among generic medications, about 40% have only one manufacturer. The increasing concentration of the production of generic drugs poses a grave risk to the millions of Americans that rely on such medications. The FDA publishes a list of critical drugs that have a shortage in supply, most of which are generic medications that depend on imports from other countries.
The increasing reliance for cheap generic drugs from foreign suppliers has led to the shuttering of manufacturing plants within the U.S. In 2019, Mylan shuttered its longtime operations in Morgantown, WV and laid off over 1400 workers. Additionally, the production of pharmaceuticals and their primary ingredients abroad is a public health concern for Americans as overseas production is not subject to the same standards as those produced in the U.S. and other industrialized countries. A lack of proper oversight upstream has led to harmful chemicals being used to produce drugs downstream, even those who produce the finished product elsewhere but have a single source of materials from China. The hollowing out of the manufacturing base of American pharmaceuticals amounts to a national security risk.
Policy Solutions
As the U.S. population ages and demand for pharmaceuticals continues to grow, especially for more affordable generic medications, the dynamics that have led to concentration of the pharmaceutical industry of the past will continue to compound.
However, the reliance on critical imported pharmaceuticals is not predetermined. A recent survey conducted by Washington University in St. Louis found that 30% of pharmaceutical companies reported utilization of 50% or less. While the survey accounted for only about 25% of U.S. manufacturers of generic medications, it nevertheless suggests that there exists total excess capacity in U.S. drug facilities that could be used to manufacture millions of doses of medication in the U.S. each year.
The Biden administration issued an executive order directing the FDA to form a list of critical medications that are “medically necessary to have available at all times in an amount adequate to serve patient needs and in the appropriate dosage forms” and accelerate domestic manufacturing to produce such medications. There is an increasing awareness and urgency to pursue policies that will incentivize the reshoring pharmaceutical manufacturing of generic medications.
One step toward reversing the trends that have led to a shortage of critical medications is to encourage domestic production through tax credits. The Inflation Reduction Act appears to have given a $22 billion boost to the electric vehicle and renewable energy industries and could work effectively in pharmaceuticals too. Tax credits can counter the Chinese model of state subsidy and unregulated, low-cost production by incentivizing manufacturers to use existing domestic capacity to its fullest and build new manufacturing capacity to produce critical generic medications in the U.S.


