The U.S. trade deficit fell 21% to $61.5 billion in November 2022, the Bureau of Economic Analysis (BEA) said on Thursday, showing for the first time some sluggishness in domestic demand. This is the latest data made available by the U.S. government.
November exports totaled $251.9 billion, which was $5.1 billion less than October exports. Meanwhile, November imports were $313.4 billion, $21.5 billion less than October numbers.
The November decrease in the goods and services deficit reflected a decrease in the goods deficit of $15.3 billion to $84.1 billion and the year-to-date goods and services deficit increased $120.1 billion, or 15.% over last year’s numbers. Exports and imports both are up slightly over 18% from last year, which was the peak of the COVID pandemic.
The most important figure, however, is the goods deficit. It broke last year’s record of $1.09 trillion and now sits at $1.1 trillion with one month of data to go. The year will likely end with a $1.16 trillion to $1.18 trillion goods deficit, another record breaker.
Some will argue that pent up demand from lockdown restrictions beginning in 2020, and general pandemic fears among the populace, led to less spending. Stimulus payments in both 2020 and 2021 led to higher demand among consumers and businesses who spent their way through an economy going through a public health crisis.
Regardless, the trillion-dollar plus goods deficit remains part of a worrisome trendline of the U.S. sucking up the goods of the world, where the U.S. could be replacing some of that demand with local production.
“In spite of a consumer spending slowdown in November and depressed auto sales in 2022, our trade deficit continues to rise, now running at 15.7% greater than the same period in 2021,” said CPA chief economist Jeff Ferry. “Reducing the trade deficit would stimulate the domestic economy as well as reduce the excessive dependence on foreign supplies which contributes to shortages, supply chain snafus, and inflation.”
Top Five Major Exports
Pharmaceutical exports topped the leaderboard for the month, and is up by roughly $8.09 billion year-to-date versus a year ago. Pharmaceutical exports have risen more in dollar value than any other export, including the remaining top four exported goods.
| Product | November 2022 | October 2022 |
YTD 2022 |
| Pharmaceuticals | $7.61 billion | $6.38 billion | $81.64 billion |
| Industrial machinery | $6.34 billion | $6.35 billion | $68.16 billion |
| Semiconductors | $5.58 billion | $5.60 billion | $61.30 billion |
| Passenger cars | $4.63 billion | $5.05 billion | $51.25 billion |
| Automotive parts | $4.61 billion | $4.41 billion | $49.70 billion |
Top Five Major Imports
The U.S. imports similar items. The top 5 are consistent month over month. Other than commodities, these are the most hotly traded items in the world, and the U.S. is the lead buyer. The U.S. imports nearly two-times the value of pharmaceutical goods than it exports. Some of this is a market domestic producers should be able to absorb, thus lowering the trade deficit and dependence on foreign sources for medication.
The U.S. imports more electronic apparatuses than it does cell phones, but cell phones were included in this list as it is a more descriptive item than the electronic parts item listed by the BEA.
| Product | November 2022 | October 2022 | YTD 2022 |
| Pharmaceuticals | $16.26 billion | $19.14 billion | $174.11 billion |
| Passenger cars | $13.26 billion | $14.86 billion | $147.49 billion |
| Automotive parts | $10.79 billion | $11.78 billion | $123.30 billion |
| Cell phones | $7.1 billion | $9.8 billion | $123.74 billion |
| Computers | $7.09 billion | $8.22 billion | $96.22 billion |
Once again, imports rose across all of these segments, with pharmaceutical imports rising by $17.72 billion over the first 11 months of 2021.
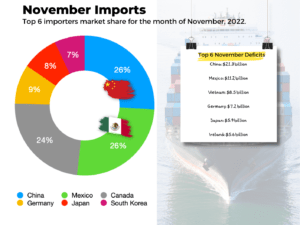
The deficit with China decreased $5.8 billion to $20.4 billion in November. And the deficit with the European Union decreased $3.6 billion to $19.5 billion in November.
China and Mexico were tied for first place in terms of their import penetration for November, both at 14.4% of all imports. Canada was second at 13.2%. Tiny Vietnam is rising. The southeast Asian nation has become an outpost of Chinese multinationals and now counts for 3.7% of all imports, more than Taiwan, a leading semiconductor exporter, and India, a leading pharmaceutical exporter to the U.S.