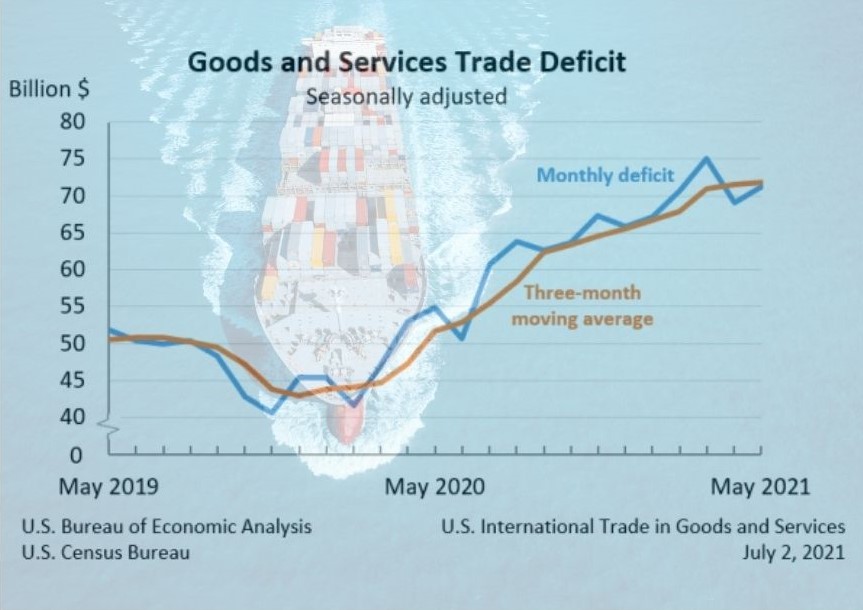
The goods and services trade deficit for May rose by $2.2 billion over April to a total of $71.2 billion, the U.S. Bureau of Economic Analysis (BEA) said on Friday. The increase is not a shocker, coming off a surprisingly lower tariff rise in April. On a value basis, the main reason for the trade gap this month has been rising commodity prices, led by fuel and lumber. As a side note, our deficit with China continues to decline.
Year-to-date, the goods and services deficit increased $110.9 billion, or 45.8% to $353.07 billion. But when you look at just the goods balance – from basic consumer goods like air conditioners and clothes, to top global exported goods like cars and pharmaceuticals – the total five-month goods deficit in the U.S. is a whopping $444.5 billion, a record-breaker.
CPA believes that at this rate, the U.S. goods trade deficit will crack $1 trillion this year. To put that into perspective, the U.S. imports the entire value of the Norwegian and Swedish economies combined.
U.S. goods exports rose by just $400 million, much less than the $1.6 billion in April, and hit $145.5 billion total. The only gainers were in consumer goods, rising a surprising $1 billion, followed by pharmaceuticals, up by $800 million. We assume this is not due to exports of Covid-19 vaccines, as the U.S. is largely giving those away.
Imports rose at a rate of four times that of exports, rising by $2.7 billion to a total of $234.7 billion in May. The main reason for this has been commodities and not China retail goods. We have seen increases in crude oil, fuel oil and Canadian lumber over the last month, along with increases in imported food.
May’s Biggest Trade Gaps
The deficit with China was $32.4 billion in April, but it fell to $27.2 billion in May. Despite all the talk of port congestion and empty containers going to China only to be quickly refilled with Made in China goods, it appears that the shortfall in shipments could be due to a temporary closure of ports in Guangdong province. June’s deficit with China should be interesting to better gauge the direction of our trade trends with them.
The May trade gap was second biggest with the European Union ($18.5 billion), Mexico ($7.7 billion), Germany ($6.2 billion), Japan ($5.9 billion), and Canada ($4.8 billion).
Other than our deficit falling with China in May:
- The deficit with the European Union more than doubled from April, up $2.4 billion to $18.5 billion. The EU imported $200 million less from the U.S. for a total of $22 billion, while we imported $2.3 billion more from them, hitting $40.5 billion.
- The deficit with Canada increased by $1.8 billion to $4.8 billion in May. Exports increased $200 million to $24.5 billion and Canadian imports here rose $1.9 billion to $29.3 billion, led by commodities.
- In Asia, our May deficit with China fell by $5.1 billion to $27.2 billion. The deficit with Vietnam rose by around $464 million to $7.4 billion, and our deficit with Malaysia rose by around $450 million to $3.7 billion. Both of these southeast Asian nations have become outposts of Chinese multinationals and a source of U.S. firms outsourcing outside of mainland China.
What We’re Buying, What We’re Selling
For manufactured goods, our top five exports are always the same. They just shift around in their starting lineup. This month, pharmaceuticals rose from number three to number one.
| May | April | |
| 1. Pharmaceuticals | $6.19 billion | $5.38 billion |
| 2. Semiconductors | $5.96 billion | $5.55 billion |
| 3. Industrial machines | $5.69 billion | $5.60 billion |
| 4. Passenger cars | $4.34 billion | $4.75 billion |
| 5. Car parts | $3.74 billion | $3.80 billion |
The U.S. continues to be a huge importer of pharmaceuticals, an industry CPA believes can play a pivotal role in reducing our trade deficit with rich Europe, and create more high-quality jobs in the U.S.
| May | April | |
| 1. Pharmaceuticals | $14.28 billion | $12.87 billion |
| 2. Passenger cars | $12.12 billion | $12.72 billion |
| 3. Cell phones | $9.71 billion | $10.50 billion |
| 4. Car parts | $9.51 billion | $9.32 billion |
| 5. Computers | $7.38 billion | $8.66 billion |
When the trade deficit is looked at overall, combining goods and services, one key reason for the gap is the massive destruction of the travel industry. Foreign travelers coming to the U.S. led to a January to May 2019 travel services trade valued at $83.76 billion. Between January and May 2021, it’s not even close to recovering, currently valued at $23.69 billion.
Meanwhile, demand for U.S. financial services continues to climb. Between January and May of 2019, financial services exports (meaning fees charged by banks and other financial firms to foreign companies and investors) was $56.77 billion. This year through May, it is $63.48 billion.