CPA Model Results Show Domestic Production Stimulus, Real Wage Increases
KEY POINTS
- A 10% “universal” tariff on all U.S. imports, combined with a schedule of income tax cuts would generate economic growth of $728 billion and 2.8 million additional jobs, according to the CPA economic model of the U.S. economy.
- The tariff would generate an estimated $263 billion, which could be used to provide a substantial $1200 tax refund to lower-income households and refunds of 3%-4% of income for middle-income households.
- Real household incomes rise by 5.7%, equivalent to $4,252, making workers better off and which more than offsets a small, initial price impact of half a percentage point per year.
- Results show progressive impact on taxation, i.e. lower/middle income households benefit more than upper-income taxpayers.
A CPA model simulation of the impact of a worldwide 10% tariff on all U.S. imports shows that such a policy could lead to increased growth in the domestic economy, higher real wages, gains in employment, and provide the revenue to enable a tax cut across all income levels sufficient to ensure that the tariff-and-tax package benefits lower-income groups more than upper-income groups.
Some economists and politicians have argued that the implementation of tariffs is a regressive tax policy, i.e. it would benefit the rich more than the poor. But this is a partial view based on simplistic assumptions. Tariffs generate revenue for the government and that revenue can be used in numerous ways to provide benefits to households. A tax package can be structured to benefit any income group or all income groups. In this paper, we propose a tax package in which tariffs boost real incomes right across the income spectrum, benefiting the lower income groups by more than the upper income groups. In this model, the tariff and tax cuts package boosts income by 10% for the poorest, and 3%-4% for the highest-income groups.
In this simulation, we apply a 10% tariff to all U.S. goods imports. The model forecasts the results of this policy for key national variables and trade flows for 25 nations and regions worldwide. The tariff makes imports less competitive and domestic production of manufactured and other goods rises to take advantage of the opportunities. Increased domestic production leads to more jobs and more capital investment. The stimulus to the goods-producing sector flows through to the services sector, with the result that the entire U.S. economy expands.
As a result of the tariff policy, real (inflation-adjusted) gross domestic product (GDP) rises by 2.86% from the pre-tariff level. Manufacturing output rises by 4.77%. Employment rises by 2.8 million as production of goods and services expands. (All these changes are in addition to the natural growth in the economy over time.) Wages also rise and the total effect is that real household incomes rise by 5.7%, equivalent to $4,252. Figure 1 shows the key results. Real GDP is higher by $728 billion (at 2023 prices).
Figure 1. Tariff/tax cut policy boosts GDP by 2.86%, household income by 5.7% and creates 2.8 million new jobs.

Prices
Consumer prices rise by about half a percent per year over an anticipated six year adjustment period, for a cumulative total of 3.26% as a result of the economic stimulus from the tariff package. This is a one-time price increase, as the increased demand for goods and services raises both output and prices. The model compares a pre-policy “equilibrium” with the post-policy equilibrium. A reasonable estimate of the time taken to go from the former to the latter state would be about six years. The one-time price increase would therefore amount to about an additional half-point on the annual rise in the consumer price index. This modest price increase matches the experience of consumer prices in the period 2018 to early 2020 (before the onset of the COVID pandemic), when consumer price increases were virtually undetectable following the imposition of the Trump tariffs which began in the first quarter of 2018.
The fundamental difference between the one-time price increase and the persistent stimulus to GDP, production and employment is that the stimulus will continue to compound over time, because production will continue to grow at a higher rate as profitability and investment stimulate more production. The one-time price increase is more than offset by the real wage increase.
Income Tax Refunds
The tariff generates an estimated $263 billion of income to the U.S. Treasury. That’s based on a 10% tariff on U.S. imports of $2.6 trillion. This is a significant sum of money, worth about 6% of federal tax receipts of $4.4 trillion in fiscal 2023. There are many ways in which this “new money” can be used: tax cuts, additional spending in the federal budget, or reductions in the federal deficit.
One proposal is to use the tariff revenue to deliver a broad-based cut in income tax. In Table 1, we show the effects of one such tax cut. The table uses Internal Revenue Service (IRS) data to break U.S. households into 18 income groups, ranging from those with adjusted gross income (AGI) less than $5,000 up to the top category of households with annual income of over $10 million.
The fourth column (Income boost due to larger economy) shows the average increase in household income due to the economic stimulus of the tariff. The tariff raises prices by 3.2%, raising the cost of consumer spending. We show the additional household spending in the fifth column. We assume that those earning below $30,000 a year actually spend more than their reported AGI due to income from social programs and credits which do not go into the AGI. We want to be careful to ensure that everybody benefits from this tax package proposal.
The sixth column shows the income tax refund that Congress could legislate to ensure that nobody is made worse off by the tax package. In our proposal, the refund is fixed at $1200 for all households reporting an AGI of $30,000 or less. Above that level, the tax refund goes from 3.5% of AGI down to zero for the millionaires. There are no tax refunds for the 875,000 households that reported an AGI of $1 million or more. The total cost of this package of tax refunds is $414 billion, equivalent to 18.9% of the total income tax revenue of $2.2 trillion.
The seventh column shows the net benefit to each taxpayer group, taking into account the negative impact of the price increase, the positive impact of the economic growth, and the positive impact of the tax refund. The eighth column expresses that benefit as a share of each group’s average AGI. The $50,000 to $75,000 AGI group is one of the largest in the U.S., with 22.6 million filing households. This is the typical hardworking middle class family. The table shows that such a family’s average annual benefit under this plan would be $3,651, equivalent to 5.9% of its AGI.
The eighth column expresses the net benefit to each group’s average household as a share of their AGI. It can be seen that the benefits of this plan range from 15.1% for those with almost no annual income, to 5% to 6% for middle class taxpayers, and then falling to the 3% to 4% range for upper income groups. No household with AGI over $1 million would receive a tax refund. Their benefits, which can be large, stem from the economic growth stimulus of the tariff.
This is a tax package that would be termed “progressive” in the simplified language of tax economics. Progressive taxes or government payments are those that are more generous to lower-income groups and decline as income rises. This tariff and tax cut package is structured to ensure a progressive outcome, in other words, the lower-income groups benefit more proportionately than the upper-income groups. However, all taxpayers are made better off.
Table 1: Tariff/income tax refund package benefits all income groups

U.S. Treasury Gains
Equally important, the U.S. Treasury is also slightly better off, even after refunding the large sum of $414 billion to taxpayers. This is due to the fact that the tariff stimulus grows the economy, leading to more tax revenue for the Treasury from income tax, social security tax, and corporate tax. We have made the very conservative assumption that corporate tax revenue rises in line with GDP growth. Table 2 summarizes the revenue/cost impact to the U.S. Treasury. The $26 billion benefit could for example be used to reduce the federal budget deficit.
Table 2: After $414B of tax refunds, Treasury still a net gainer

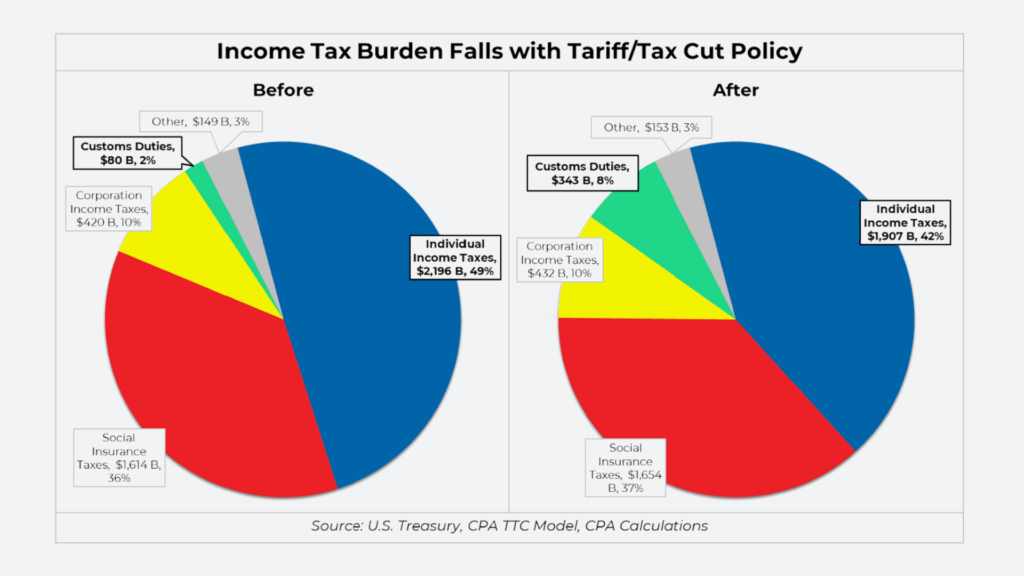
Conceptually, it is important to remember that the U.S. taxpayer benefits because a larger share of U.S. tax revenue now comes from tariffs and a portion of tariff revenues are paid by foreign exporters. Figure 2 shows how the tariff share of federal government revenue rises from 2% to 8% after the universal 10% tariff is imposed.
Figure 2. After the universal tariff is imposed, income tax burden falls by $289 billion.

The GTAP-FP Model
Traditional international economic models are based on unrealistically rigid assumptions which bias the model to favor free trade. The most misleading of the assumptions is the insistence on full employment both before and after a change in trade policy. Since almost all trade policies impact employment and unemployment in all the national economies affected, the models produce misleading and often wildly misleading results. We have previously explained the standard models’ problems and their misleading results.
CPA uses the Global Trade Analysis Project (GTAP) model, developed at Purdue University. The virtue of this model is it can be modified by its users. Our modified version of the model allows more flexibility in how the domestic economy responds to trade actions such as import restriction via tariffs. We call our modified model GTAP-FP. GTAP-FP adds two new relationships to the standard version of GTAP. The first allows domestic production to respond to greater demand for domestic goods created by applying tariffs to imports. The second allows the economy to increase its capital and labor resources in response to greater demand. The coefficients used in these new relationships are based on data cited in a USITC study last year and other evidence from U.S. experience following tariffs imposed in 2018 and 2019. A recently published technical description of GTAP-FP is available in the peer-reviewed journal, Empirical Economics Letters. (1)
Why our analysis is different
To summarize, our model simulation says that a policy of 10% universal tariffs would stimulate the U.S. economy to grow by nearly 3%, create nearly 3 million additional jobs, and raise real household incomes by close to 6%.
This is very different from reports by several mainstream economists. The most comprehensive of these reports is a lengthy document, Why Trump’s Tariff Proposals Would Harm Working Americans (2), by UCLA economist Kim Clausing and Peterson Institute economist Mary Lovely. It was recently cited by the White House’s Council of Economic Advisers (3). The Clausing-Lovely report criticized both Donald Trump’s tariff proposals and President Biden’s recent expansion of Section 301 China tariffs to cover more goods. Clausing and Lovely’s critique focused on claims that tariffs raise prices, reduce economic growth, and are regressive in tax terms.
Let’s deal with each of these in turn.
In 2018 and 2019, then-President Trump enacted tariffs, primarily at 15% and 25% rates. In the period before the post-COVID pandemic inflation, few consumer prices rose by anything like the 15% or 25% value of the tariffs. Most consumer goods prices continued at the then-standard inflation rate of around 2%. How then did academic economists conclude that tariff rates were “fully passed through” (Clausing/Lovely, pg. 4) to U.S. consumers? The answer is that they did studies of monthly import prices from China and showed they did not change immediately after the imposition of the tariffs. They therefore concluded that the tariffs were layered on top of the import prices and must have increased the total costs U.S. importers paid for these goods. However our own examination of import data from China shows that the tariffed import categories fell by some 30% after tariff imposition while imports from untariffed categories rose by 20% to 30%. In addition, imports from other countries rose. This pattern suggests that importers substituted non-tariffed products and components for tariffed, so the “pass-through” of price increases was likely far less than 100%.
The most reliable study looking at the impact of tariffs on prices of both industrial goods and consumer goods was done by the U.S. International Trade Commission last year (4). This study looked at actual market prices in the U.S. instead of reported import prices. It found that U.S. price increases for the goods whose imports were subject to tariffs were generally between 10% and 20% of the tariff rate. For example, the 2018 tariff on steel was set at 25%. The USITC report found that the tariff increased the average steel price in the U.S. by just 2.47%. Reasons for the very small impact on prices actually paid in the U.S. include the fact that imports are only a minority of the U.S. market in most commodities, and the fact that prices are determined by many factors besides direct costs. This finding undermines the whole of the anti-tariff broadside of mainstream economists. It is reinforced by our own research with buyers, sellers, and intermediaries of products such as steel and electronics.
The USITC report did not receive much publicity. The USITC economics team does excellent work, but does not publicize it since USITC leadership does not promote the agency’s work. We published a concise summary of the USITC report here.
One other study that looked at the impact of tariffs on consumer prices found no significant relationship between the headline value of the tariff and the impact on consumer prices: “it is difficult to discern any quantitatively important price differences brought about by the tariffs (5),” said this 2021 article, whose authors included one Harvard professor, former Harvard professor and now IMF Deputy Managing Director Gita Gopinath, one Federal Reserve Bank economist, and one former Chicago economist who is now an official in the Biden Treasury.
This article found that a 10% tariff led to only a 0.35% increase in the consumer price of that product a year later, a much smaller impact of the Trump China tariffs on retail prices even than the USITC report. The range of results in the various studies shows that price-setting by producers or others in the value chain is influenced by a myriad of factors and academics’ regression analysis studies, which selectively choose only a small number of such variables and attempt to generalize across industries and across time, are unlikely to get to the reality of the price-setting process in a modern economy.
The discussion of tariffs and economic growth is much simpler. Free-trade economists like Clausing/Lovely or the Tax Foundation claim that tariffs, or more generally import restriction, cannot generate economic growth. This is based not on any evidence but on an undergraduate-level model of an economy in which full employment is assumed to exist eternally. Once one concedes that imports can reduce employment (as well as GDP, revenue, incomes and investment) by taking away market share from U.S. producers, and import restriction can do the reverse, i.e. increase incomes and jobs, it is obvious that import restriction, properly executed, will grow an economy. In a forthcoming book, Industrial Policy for the United States (6), authors Marc Fasteau and Ian Fletcher document the successful use of import restriction in dozens of cases in international history, including the U.S. economy in the 19th century.
The alleged regressiveness of tariffs is another example of the rigid application of a very limited view of taxation, valid as a teaching tool in undergraduate economics but hopelessly out of touch with real world economies. A tariff on consumer goods which raises over $200 billion can be used in any number of ways. Above we provide an example of how such a tariff can be combined with income tax policies to generate progressive change in the U.S. tax system.
Conclusion
A combined tariff/tax cut policy is likely to stimulate the U.S. economy, generating greater production, more employment, and more investment in domestic industries, with small and perhaps imperceptible costs. Our main concern with the policy is that 10% tariffs may not be sufficient to produce a significant stimulus, in light of other economic headwinds in the U.S., in particular the 20%-25% estimated overvaluation of the U.S. dollar, the large U.S. trade deficit, and the oligopolistic nature of U.S. industry, which will require large, sustained policy changes to reinforce the message to multinational business that the U.S. government intends to fight to rebuild American industry.
(1) Jeff Ferry, Badri Narayanan Gopalakrishnan, An Economy-Wide Model with Flexible Supply Response to Taxes and Tariffs, Empirical Economics Letters, Volume 23, No. 5, May 2024. Available here.
(2) Kimberly Clausing and Mary Lovely, Why Trump’s Tariff Proposals Would Harm Working Americans, Peterson Institute, Policy Brief 24-1, May 2024, available here.
(3) White House, Tariffs as a Major Revenue Source: Implications for Distribution and Growth, July 12, 2024. Available here.
(4) USITC, Economic Impact of the Section 232 and 301 Tariffs on U.S. Industries, March/May 2023, Publication 5405. Available here.
(5) Alberto Cavallo, Gita Gopinath, Brent Neiman, Jenny Tang, Tariff Pass-Through at the Border and at the Store: Evidence from US Trade Policy, American Economic Review: Insights 2021 3(1), pg. 28-29. Available here.
(6) Marc Fasteau, Ian Fletcher, Industrial Policy for the United States, Cambridge University Press, Forthcoming, August 2024. For information, see here.