CPA Working Paper
By Stephen L. Byers PhD and Jeff Ferry
Abstract
The Coalition for a Prosperous America is introducing the new CPA Reshoring Index to track the success of US manufacturing industry in meeting domestic demand for manufactured goods.
The CPA Reshoring Index (CRI) measures the annual change in the share of US consumption of manufactured goods that is met by US producers. There are many indicators of US trade performance, but not enough indicators of how well US industry succeeds in its home market and the CPA Reshoring Index (CRI) attempts to redress that balance.
Success in our home market is critical to the success of the US economy. The US economy is the world’s largest market, accounting for some 24 percent of global GDP. Declining success in our home market, in other words increasing import penetration in virtually every sub-sector of manufacturing, has been a root cause of declining manufacturing employment, declining real incomes for large sectors of the population, increased inequality, and a slower national growth rate.
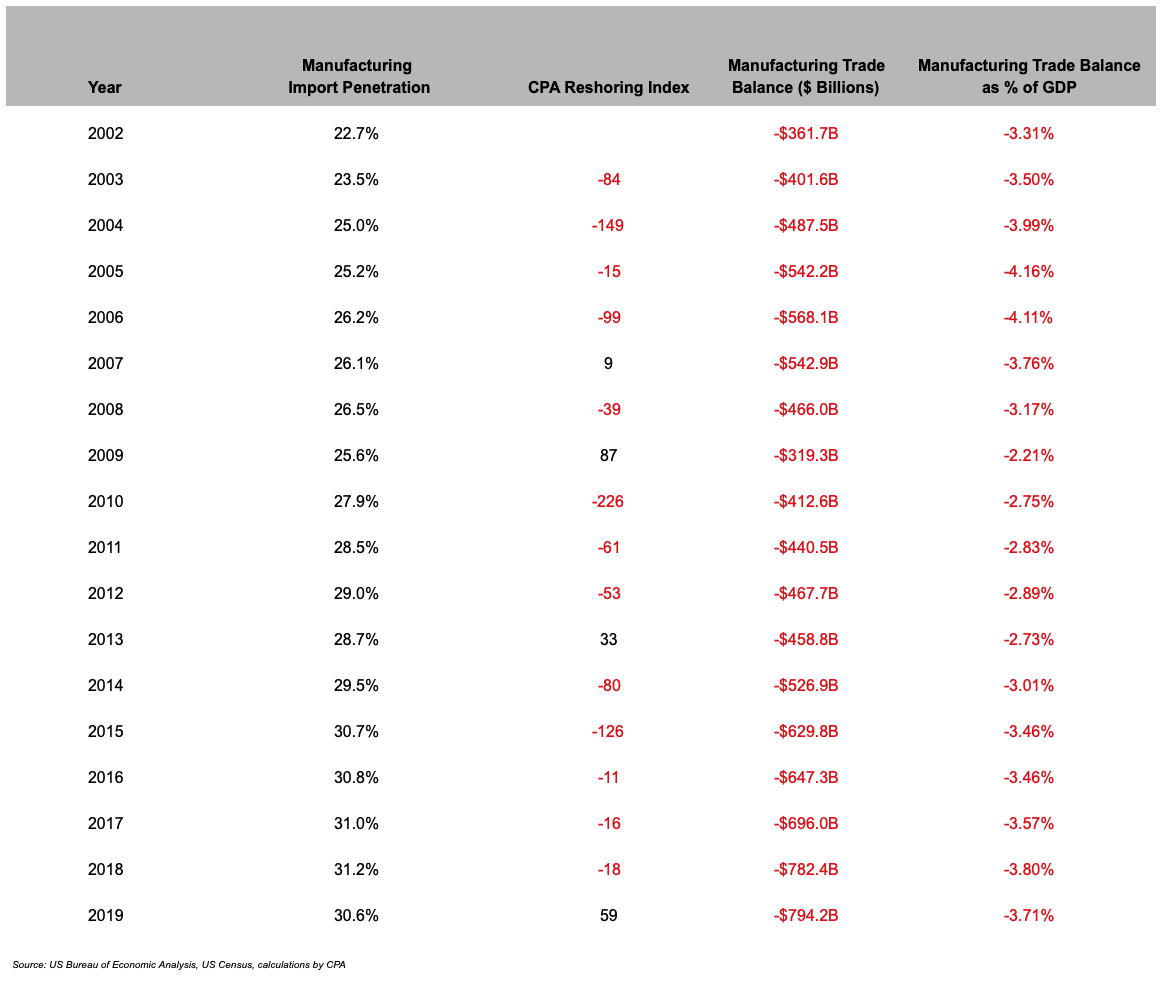
Last year, the CRI was 59, which means the US share of US manufacturing consumption rose by 59 basis points (0.59 percent) over its 2018 level. This is the largest non-recessionary growth in reshoring since the Index begins in 2002. In most years since 2002, the CRI has been negative, indicating that imports took an increasing share of US manufacturing consumption.
Tracking manufacturing reshoring provides an important perspective not shown in other economic data. Measures such as manufacturing output, manufacturing trade balance, or manufacturing employment chart absolute or relative growth or decline and are heavily influenced by growth trends in the world economy. The Reshoring Index is an indicator focused solely on the performance of US industry in the US market. Developing the CRI has also enabled us to calculate similar indexes for the 19 sub-sectors of US manufacturing. Those sub-indexes show us, for example, that the apparel sub-sector is the most heavily penetrated by imports, at 92.8 percent, and that printing is the least, at just 6.8 percent.
Introduction and Overview
Last year, the US imported $2.16 trillion worth of manufactured goods. For the US to restore growth to our manufacturing sector, the largest market opportunity is to recapture our own home market. To highlight the size and importance of this market opportunity, the Coalition for a Prosperous America has developed the CPA Reshoring Index (CRI). The CRI measures the change in US market share in its own manufacturing market each year. Today we are introducing this new important measure of the success of the US economy in regaining share in its own market.
Last year, the CRI was 59, which means that the US regained 59 basis points of share in the US manufacturing market. To put it another way, import penetration in manufactures fell by 59 basis points, from 31.2 percent in 2018 to 30.6 percent in 2019. That is a small change in terms of percentage points, but consider that last year, the US consumed manufactured goods worth a total of $7.1 trillion. Small changes in the share of that consumption that is produced here at home can have a very large impact on US employment and prosperity.
We calculate the CRI entirely from data published by the federal government. Although the Census Bureau and other agencies produce huge volumes of data, they publish no measure of total US imports of manufactured goods nor of total US consumption of manufactured goods. We were able to build such measures. The US Bureau of Economic Analysis (BEA) divides the manufacturing sector into 19 subsectors. It publishes gross output for each subsector on a quarterly basis. By adding up the subsectors, we produced a total for US annual manufacturing output going back to 2002.
Total US domestic consumption of manufacturing goods is equivalent to US manufacturing production plus the amount of foreign manufactured goods brought in from overseas (imports) less the amount of US manufactured goods shipped out of the country (exports). The export and import data for each of the 19 manufacturing subsectors is available from US Census data. One caveat to keep in mind is that sometimes consumption is defined based on household purchases of goods or services in a specific sector. But for the purposes of import market share, it is more straightforward to calculate consumption based on sales by the producing sectors. In effect, our figure for consumption of goods in a subsector refers to consumption by all purchasers including wholesalers, retailers, and households.
Next, we calculate imported manufactures from US Census data on US imports. This data is coded by industry codes known as NAICS codes and using the NAICS codes, we can categorize imports into the same 19 subsectors as in the BEA data. Summing up the subsectors, we produce an annual figure for total imports of manufactures. That import total, expressed as a share of total manufactured consumption gives us the import market share.
The annual change in import market share is the Reshoring Index. A fall in import share is equivalent to a rise in the share of consumption taken by domestically produced manufacturing output, yielding a positive Reshoring Index. A rise in import penetration is a fall in domestic share and a negative Reshoring Index. The Reshoring Index is expressed in hundredths of a percentage point, known as basis points (bp).
This methodology also enables us to calculate the trade deficit in manufactured goods. Last year’s trade deficit in manufactures was $794.2 billion. The US Census produces monthly data on the US goods balance and US services balance. The goods balance (which has been in deficit for most of the last half century) is broader than the manufacturing measure because it includes agricultural commodities, mined commodities, forestry, crude oil and other non-manufactured imports and exports. For example, last year’s goods deficit was $866.0 billion, $72 billion larger than the manufacturing deficit.
The goods deficit improved in 2019, by $21 billion. But this is entirely explained by our petroleum balance, which Census data shows improved by $36 billion to a small petroleum sector deficit of $13.7 billion. CPA’s manufacturing trade balance data shows the deficit worsened by $12 billion. However, as a share of GDP it improved by 10 basis points, to 3.71 percent of GDP, reflecting the positive reshoring that took place in 2019. As a share of GDP, the manufacturing trade balance reached its worst-ever level in 2005, when it reached 4.16 percent of GDP. See Figure 3 and Table 4 and discussion below for further details.
The importance of the manufacturing trade balance and the Reshoring Index stems from the importance of manufacturing in US economic growth. US economic growth has primarily been achieved through increasing productivity in domestic manufacturing , which enabled US industry to increase wages to US workers, increasing their purchasing power, which leads to increased consumption overall throughout the entire economy. This is commonly referred to as the multiplier effect.
This growth path has historically differed from other economies. The world’s first industrial revolution, in Great Britain in the 1700s, was based on importing cotton from India and America and exporting finished textiles to the world. Exports were necessary to pay for imports. In modern times, Japan pioneered an Asian model of export-led growth, now widely adopted in Asia.
But US economic growth has always been domestically driven. The move to globalization in the 1990s, sometimes called “hyper-globalization” to distinguish it from the more gradual process of internationalization before 1990, drove down US real wages in many industries as cheaper imports forced US industry to drive down costs, breaking the virtuous circle that had reigned for the previous 200 years. US economic growth per person has hovered around 1 percent in the past 10 years, a huge decline from the 3 percent average growth rates seen in our industrial heyday in the 1960s. The combination of slower growth and lower real wages, especially for the less-skilled portion of the workforce, has led to greater income inequality.
For the US to return to its historically higher growth rates, it must first increase its share of the domestic market. History shows that for countries to conquer global markets, they must first consolidate leadership in their home market. Thus, even globalists who would like the US to trade more should support a stronger domestic manufacturing industry. Great Britain enacted a ban on imported fabrics from India in 1700 to enable its domestic textile industry to grow. When the ban proved insufficient because of trade divergence, mainly through the Netherlands and France, the British Parliament enacted fines for Britons found wearing India-made calicoes in public. (Calico, after the Indian city Calicutt, was the name for printed Indian fabrics, then the highest quality in the world.) Similarly, Japan enacted strict import quotas after 1945 to enable it to build a world-class steel industry, shipbuilding industry, and later an auto industry.
Our data shows how the US has consistently lost share in its home market. Table 1 below shows that between 2002 and 2018, manufacturing import penetration into the US market rose by nine percentage points to reach 31.2 percent. In other words, in 2018 almost a third of US manufacturing demand was met by imports.
We have also calculated Reshoring Indexes and import penetration figures for each of the 19 manufacturing subsectors. Our findings include the fact that the highest levels of import penetration in 2019 were in the Apparel, leather and related products sector at 92.8 percent and in Computers and electronic products at 67.6 percent. The lowest level was in the relatively small subsector, Printed materials and related support activities, at 6.8 percent. (See Table 3 and further discussion below.)
Table 1. Import Penetration and CPA Reshoring Index, 2002-2019

Reshoring in 2019
The CPA Reshoring Index (CRI) reached 59 last year, its largest positive move since 2002 outside of the recession year 2009. The Reshoring Index has been in positive territory only three times since 2002, indicating that US industry has consistently lost share to offshoring in most of the timespan. Reshoring took place in 2009 as the recession cut back on US demand for manufactured imports. But the subsequent recovery led to a resumption of massive offshoring between 2010 and 2015, with strong negative reshoring indexes and a net loss of 5 percentage points of market share to imports in those five years.
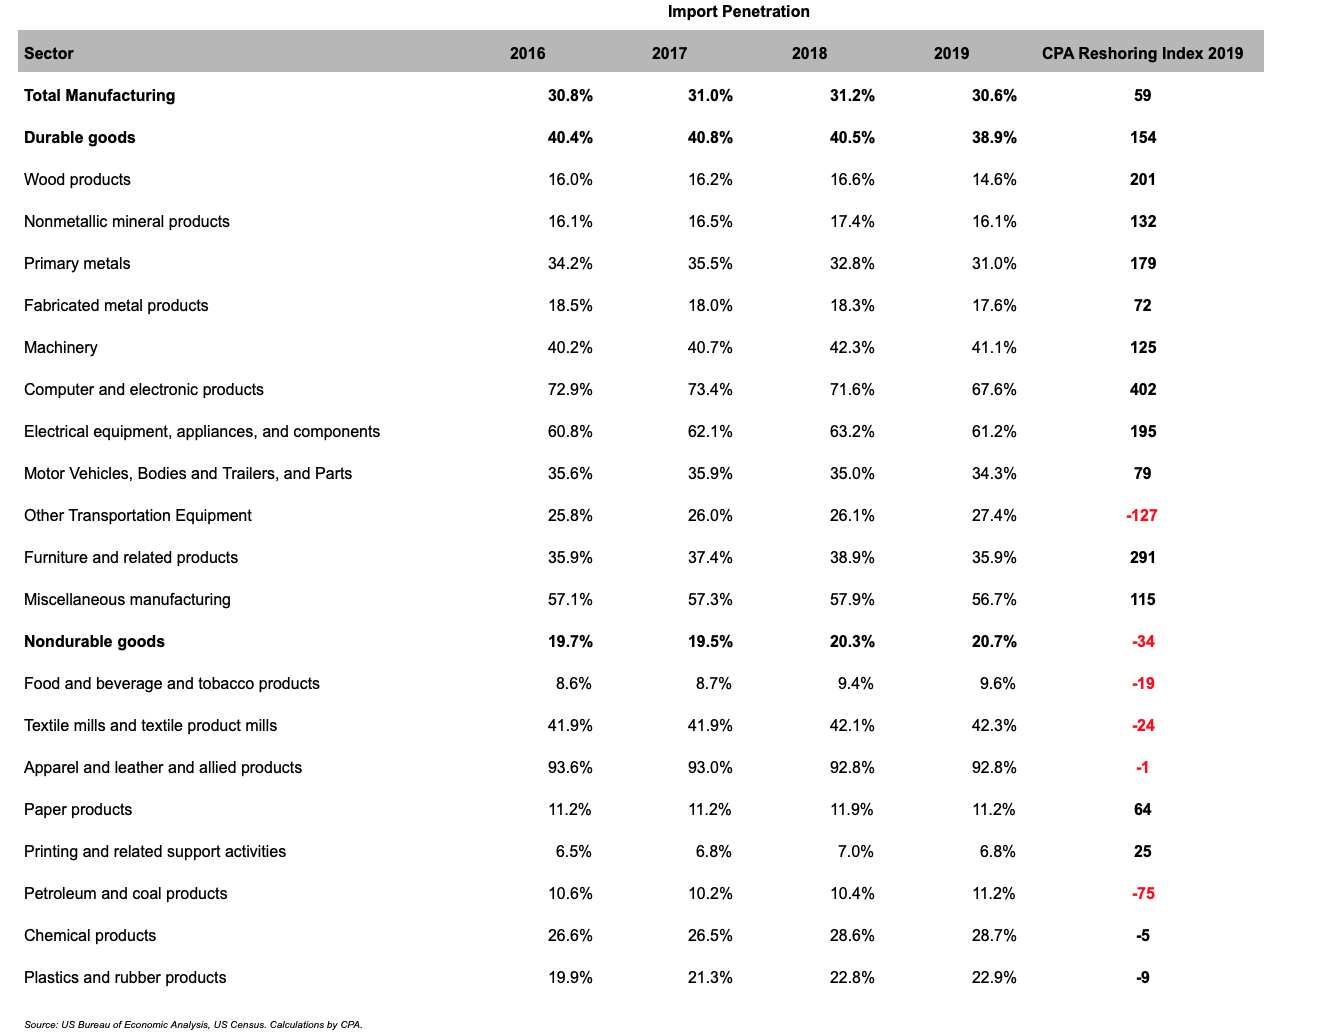
Last year, the Reshoring Index for durable goods reached 154, its highest level since the data series began in 2002 (See Figure 2 and Table 2 below). The durable goods subsector is important because it includes higher-value products like primary metals, autos, and computers, and generally pays higher wages than the nondurable manufactures sector or the services sector.
The positive increase in the Index since 2018 reflects growth in US manufacturing output of 0.8 percent last year, while manufactured imports fell by 1.0 percent. The improvement in the Index for all manufactured goods and for durable goods is evidence that the Trump administration tariffs are working in restraining imports. Beginning in March 2018, the administration levied a series of Section 201 and Section 232 tariffs on worldwide imports in specific industrial sectors, followed by tariffs on about half of US imports from China under Section 301. The tariffs restrained imports while US production and consumption both rose, leading to a fall in import penetration in most manufacturing sub-sectors. US Trade Representative Robert Lighthizer argued that the administration is determined to support reshoring in a recent New York Times article: “The era of reflexive offshoring is over…. Over the long run, the path to certainty and prosperity is the same for our companies as it is for our workers: Bring the jobs back to America.” The shortages of medical equipment and drugs amid the COVID-19 pandemic is reinforcing this view, piling national security and health security concerns on top of the economic costs of offshoring.
However, it is too early to say that the economic evidence shows that the strong reshoring trend of 2019 will continue in the long term. Part of the reason for the reshoring of 2019 may be that imports surged in 2018 as several industries rushed to bring goods in before tariffs became effective, leading to an abatement of import growth in those sectors in 2019. In many of the 19 subsectors, more evidence of a resurgence in domestic production will be necessary before we can conclude that reshoring is a sustained long-term trend.
The word “reshoring” is often used to describe an individual company’s decision to relocate its production from a foreign to a US location. This type of reshoring lies behind some of the changes in our index. For example, the Reshoring Index for the furniture subsector was a strong 291 for 2019, reflecting in part decisions by US furniture makers like Williams-Sonoma to reduce production in China and increase production at US locations. However, in many cases, the Reshoring Index was positive not because a company established a new plant in the US but because companies scaled down imports while raising production at existing US facilities. See note below, Other Measures of Reshoring, for further information on alternative ways to measure reshoring.
Table 2. Recent Trends in Import Penetration in Manufacturing Subsectors, 2016-2019

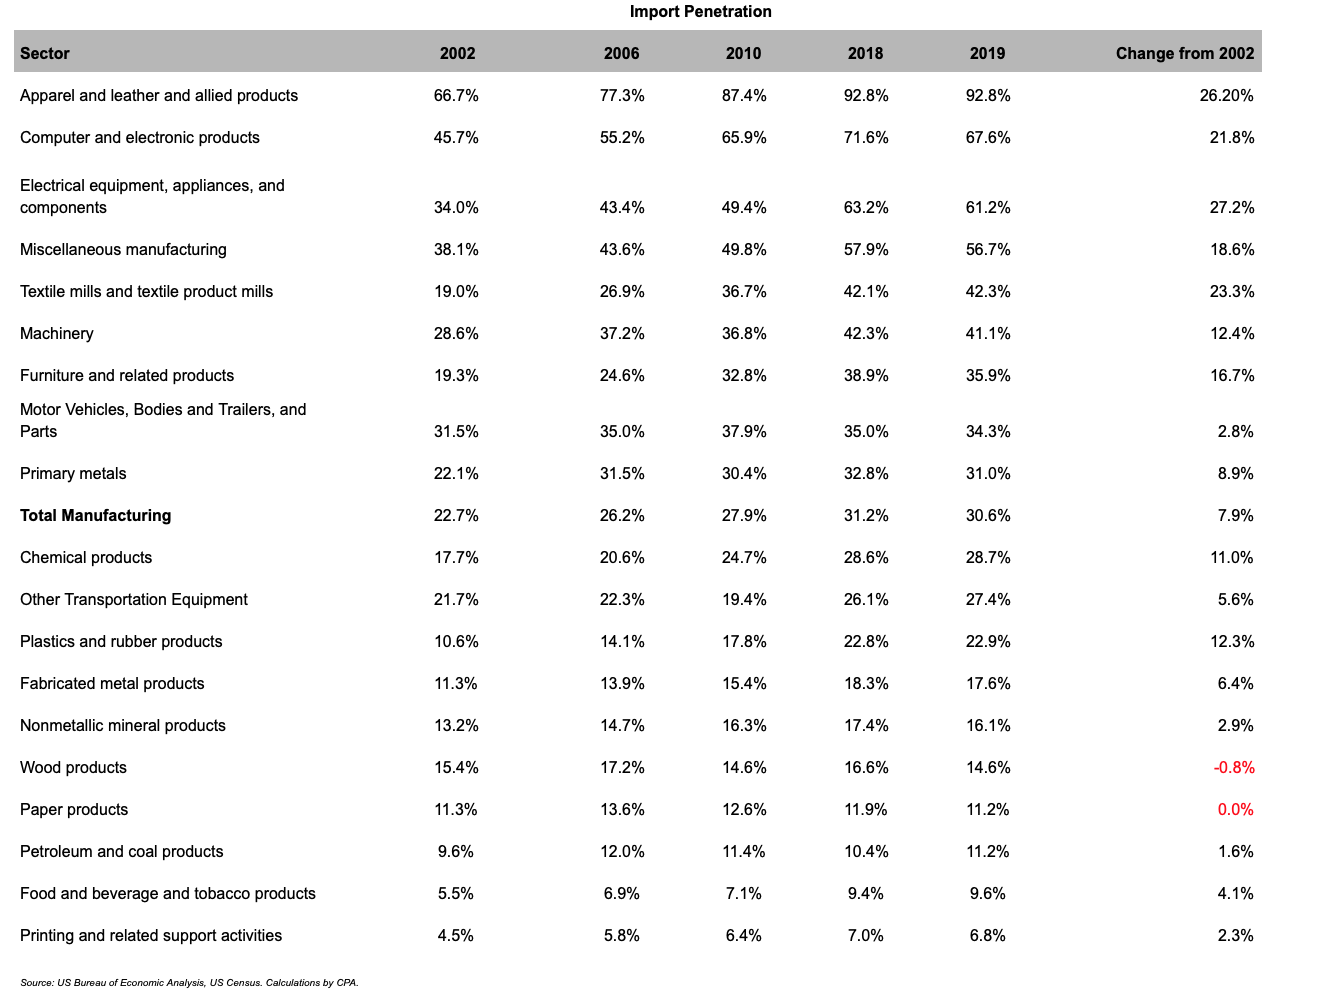
Analysis by sub-sector (see Table 3) shows that the Apparel sector had the greatest import penetration as of last year, at 92.8 percent. In other words, only some 7 percent of the apparel, leather, and related products consumed in the US were manufactured in the US. The sector with the second-highest level of import penetration was Computer and electronic products, at 67.6 percent, while Electrical equipment, appliances and components came in third, at 61.2 percent.
For Total Manufacturing, the US suffered a 7.9 percent loss in share between 2002 and 2019, with import penetration reaching 30.6 percent in 2019.The column at the right of Table 3 shows that the sectors where the US lost the most market share in the 17 years from 2002 to 2019 were Electrical equipment, Apparel, and Computers, respectively. We can see from Table 3 that the US lost share to imports in 17 out of the 19 manufacturing sectors. Only in Wood products and Paper products did the US gain share in these years and even in those two (relatively small) sectors the gains were less than 1 percent each. In contrast, the US suffered double-digit losses in domestic market share in nine sectors, including some of the largest sectors in terms of dollar value.
The pervasive rise in import penetration across such a broad swath of US manufacturing highlights the failures of trade policies in the last two decades. The loss of market share in manufacturing and the persistent trade deficit of some 2 to 3 percent of GDP has led to a loss of some 5 million manufacturing jobs and an average loss of income of some 19 percent for those manufacturing workers who found employment in the service sector.
Table 3. Manufacturing Sectors Ranked by 2019 Import Penetration

In the context of this consistent increase in import penetration across the majority of manufacturing sectors for many years, the reversal of this trend in 2019 is striking. While an overall Reshoring Index of 59 is impressive, even more impressive is the fact that eight sub-sectors scored triple-digit Reshoring Indexes, meaning that import penetration fell by more than 1 percent. In the Computer and electronics sector, import penetration fell by a huge 4 percentage points.
The reduced import share in computers and related products is traceable to the Section 301 China tariffs, since China is our largest supplier of computers and related electronics. The Reshoring Index of 179 for Primary metals similarly reflects the effects of tariffs. Steel and aluminum imports were reduced with the Section 232 tariffs enacted in 2018. In 2019, both the Computer sector and the Primary metals sector saw their lowest level of import penetration since 2010.
However, it’s not clear that strong positive Reshoring Indexes and shrinking import share will continue in manufacturing in future years. While some industries, such as primary steelmaking, have invested billions of dollars in expanded steelmaking facilities, other industries, such as computers, have so far shown little inclination to invest in new US-based manufacturing facilities. It’s likely that additional policies will be needed. Such policies are likely to include realigning the US dollar to a more competitive level and a mix of tariff, quota, tax incentives and other policies to stimulate US-based production.
Manufacturing Trade Balance
A closer look at the manufacturing trade data enables us to calculate the annual balance of trade in manufactured goods. As Figure 3 shows, that performance is not good. Our manufacturing trade deficit has more than doubled in the 17 years between 2002 and 2019, falling from -$361 billion to -$794 billion last year. It has also deteriorated as a share of GDP, declining from -3.31 percent to -3.71 percent of GDP. As with all measures of the US trade deficit, the US is the only nation in the world that would be permitted to sustain deficits for more than 40 years. Any other nation would have had a currency crisis that would have forced it to reassess its policies (and likely impose draconian tax measures to rein in consumption). This is a major flaw in the so-called liberal international trading system and US manufacturing companies and their employees have been forced to bear this cost for four decades.
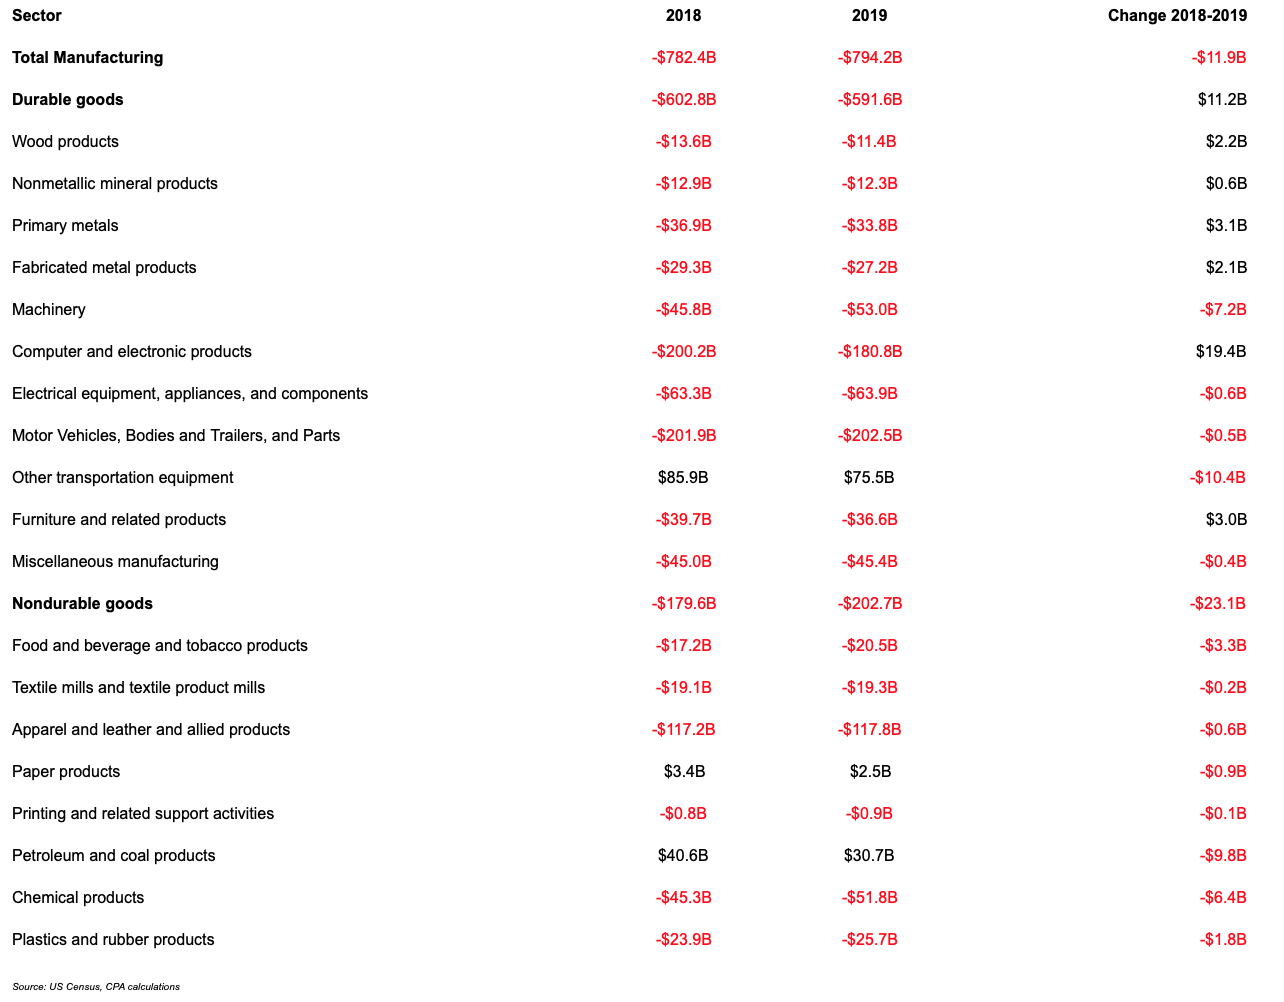
Looking at the 19 sub-sectors of manufacturing, it is striking that we have a trade deficit in all but three sectors: Other Transportation (mainly airplanes and related parts), Paper products, and Petroleum and coal. It is very unusual for a major manufacturing nation to have such pervasive deficits throughout the manufacturing sector. On a more positive note, our trade balance in durable manufactures improved by $11.2 billion in 2019, its first improvement since the recession year of 2009. The improvement was driven entirely by a $19.4 billion improvement in our balance in computers and related electronics.
Table 4. Manufacturing trade balance by sub-sector

Import Penetration by Selected Trading Partner
We also looked at manufactured goods import penetration by regional and national trading partner. As shown in Figure 4 the dramatic rise of China is clearly visible. China rose from 2.8 percent of our manufactured imports in 2002 to 7.6 percent in 2018. Its share was much larger in specific sub-sectors. However, its share fell sharply in 2019, to 6.2 percent. It is quite possible that the European Union’s share of US manufactured imports could surpass China’s share in the next couple of years if tariffs or other sanctions are maintained on China.
Other regions have benefited from the tariffs on China imports. The ten countries of ASEAN (Association of Southeast Asian Nations) have seen their share of the US market rise as US, Chinese, and other producers moved production out of China and into ASEAN nations like Vietnam and Thailand. Mexico and South Korea have also benefited.
Conclusion
The CPA Reshoring Index is a new index providing a new measure of the share of US consumption of manufactured goods that is met by domestic producers. The 2019 Index of 59, reversing five previous years of negative Reshoring Indexes, shows that US manufacturing industry took share from importers for the first time since 2009.
However, it is too early to say this trend will be sustained over the long term. In some industries, the growth in reshoring is due to domestic investment. For example, the US steel industry is investing billions of dollars in high-productivity electric arc furnace steelmaking, which will position it to continue to take share from imports, even government-subsidized imports from China. Other industries, like computers and electronics, have shown little sign of investing in US production, suggesting that further policy measures will be necessary to spur domestic production in these areas. On a national basis, government data shows that investment in overall industry still remains well below levels in the 20th century. Investment is a crucial factor in growth and competitiveness.
Measuring the scale of reshoring also allowed us to calculate for the first time the US trade deficit in manufactured goods. Last year, this deficit was -$794 billion, showing the scale of US demand lost to foreign producers. That is a loss of revenue, investment, and jobs. The broad-based rise in import penetration since 2002 in 17 out of 19 manufacturing subsectors, and a manufacturing trade deficit in 16 out of the 19 subsectors illustrate the negative momentum that has dominated the manufacturing sector for most of the 21st century. Manufacturing is a high-value-added sector that is crucial for economic growth, middle-class jobs offering good wages and benefits, leading ultimately to broadly shared prosperity.
Reshoring US manufacturing industry, or reconquering the US domestic market, will be a crucial element in recapturing the economic growth of America’s most successful century of economic growth, from 1870 to 1970. CPA will be publishing regular quarterly updates to the Reshoring Index to monitor developments in these important measures of US economic performance.
NOTE: Other Measures of Reshoring
In April this year, management consultant firm AT Kearney published the latest edition of the AT Kearney Reshoring Index. The Kearney Index tracks the share of US manufactured imports coming from 14 Asian nations. A Kearney index of 98 for 2019 was the highest Kearney index since the index was launched seven years ago, confirming the CPA Reshoring Index result showing positive reshoring. Kearney noted in its report that US tariffs and other trends are leading more multinationals to seek to diversify their manufacturing sources, reduce reliance on China, and pay attention to “risk” and “resilience.” The Kearney index focuses on 14 nations on the view that their low wages have led multinationals to choose those locations for manufacturing. Kearney stresses that corporate managements should take other considerations into account beyond short-term cost. It argues that the coronavirus crisis, and the stress on international supply chains should make companies rethink their sourcing strategies.
Consultant Harry Moser maintains a Reshoring Initiative which tracks US companies that have brought jobs back to the US. Moser’s website offers information on the benefits of manufacturing in the US and hundreds of case studies of companies that have opted to reshore production. His cumulative total of the number of jobs that have been created by companies that have reshored production stands at 749,000.


