Key Points
- China ran a record-high trade surplus in 2022 of $878 billion, equivalent to about 4.8% of its GDP.
- China continues to rely on beggar-thy-neighbor export growth reliance. Last year China exports grew 7% while the domestic Chinese economy only grew at 3%, indicating that despite the talk in Beijing, China has not meaningfully boosted domestic consumption.
- The U.S. is the largest market for China’s exports. Yet, partial decoupling with the Chinese economy is apparent, as exports to the U.S. grew by only 1.1% in 2022. However, some products may be shipped to the U.S. through third countries especially in Southeast Asia.
- China is boosting its exports to other markets, especially those in Southeast Asia, thus transmitting imbalances and thus instability to other countries.
China’s Trade Surplus Reaches Record High
China’s trade surplus reached a record high in 2022 of $877.6 billion. This report is based on data published by the Chinese government, the only agency that collects comprehensive data on China’s global trade. For the year, China’s exports grew by 7% to $3.59 trillion while imports remained nearly flat, up only 1.1%, at $2.71 trillion. China’s persistent and increasing trade surplus is a result of its export-dependent growth strategy.
Figure 1: China’s Increasing Trade Surplus (1990-2022)
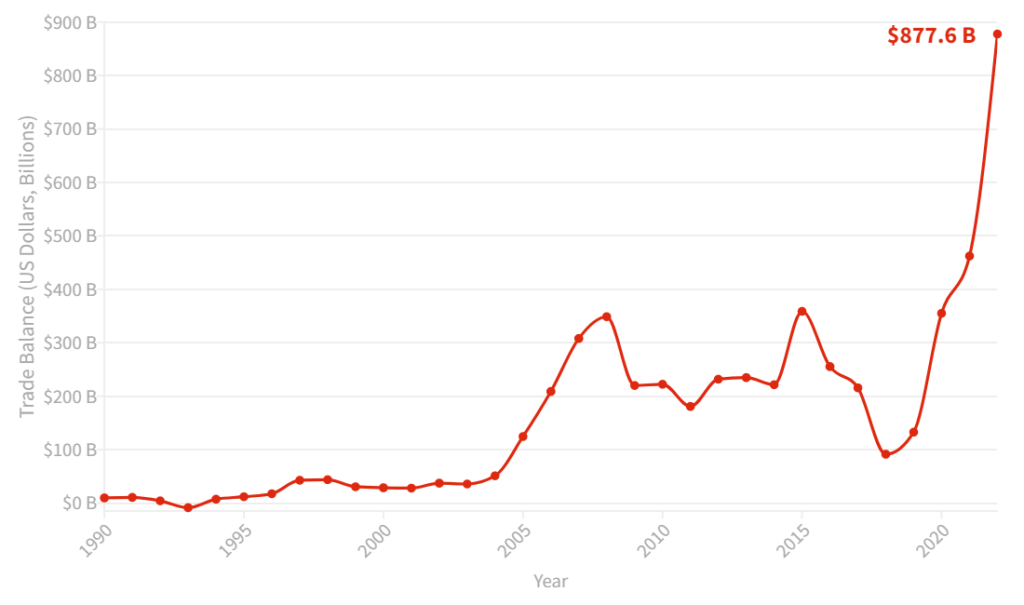
Source: World Bank
Despite China’s overall exports growing, the data indicate that recent U.S. trade policy is causing a decoupling trend. The U.S. remains China’s largest trading counterparty by far buying $582 billion in exports in 2022, accounting for 16% of the total value of exports from China. The U.S. share exceeds the next three trading countries combined of Japan, South Korea, and Vietnam. Yet, year-over-year exports to the U.S. were nearly flat in 2022, increasing by only 1.1%
Table 1: China’s Top Ten Export Markets (US Dollars, Billions)
| Country | 2022 Export Value |
Percent Change in Export Value from 2021 | 2022 Import Value |
Trade Balance |
| United States | $581.8 | 1.1% | $177.6 | $404.1 |
| Japan | $172.9 | 4.4% | $184.5 | -$11.6 |
| South Korea | $162.6 | 9.5% | $199.7 | -$37.0 |
| Vietnam | $147.0 | 6.7% | $88.0 | $59.0 |
| India | $118.5 | 21.7% | $17.5 | $101.0 |
| Netherlands | $117.7 | 15.0% | $12.5 | $105.2 |
| Germany | $116.2 | 1.0% | $111.4 | $4.8 |
| Malaysia | $93.7 | 19.7% | $109.9 | -$16.2 |
| United Kingdom | $81.6 | -25.0% | $21.8 | $59.7 |
Source: General Administration of Customs of the PRC; CPA Calculations
After the Trump administration imposed Section 301 tariffs on Chinese goods in 2018, China’s exports to the U.S. decreased by 12.5% the following year in 2019. While exports to the U.S. have increased in subsequent years, the growth has been less than growth in China’s total exports. China’s exports to the Association of Southeast Asian Nations (ASEAN), increased by 18%. Some of those goods could be destined for transshipment to America, simply to avoid tariffs. Others are likely assembled into products in ASEAN countries, or Mexico, and thereafter shipped to the United States.
Export Reliance and Weak Domestic Consumption
China’s development policy is reliant upon a mercantilist “beggar-thy-neighbor” strategy, where the renminbi is persistently undervalued to make its exports cheap in foreign markets. China’s growth has been fueled not by growing its anemic domestic consumption, but by increasing manufacturing solely for foreign consumption.
While this export-oriented development strategy has grown its economy, a result is that China excessively relied upon U.S. and other countries’ consumers to do so. China’s weak domestic consumption, which is measured by the total goods and services consumed as percentage of GDP, is far below the world average. As a percentage of its GDP, China’s domestic consumption by households is 38%, in contrast to the world average of 55% and high income countries of 58%. By comparison, consumption by households in the U.S. is 68% of GDP.
Beijing has long outlined growth plans that claim to focus on increasing domestic consumption. But it remains extraordinarily low, increasing by only four percentage points since 2018, a level which is 16% lower than when it joined the WTO in 2001.
As the world’s second largest economy, China’s constant increase in exports creates imbalances that threaten to destabilize the entire world economy. The relative decline in China’s exports to the U.S. has led to more export pressure into markets in Asia and Europe. As those exports displace local production and jobs, those nations will get more anxious to find new export markets. For example, while China’s data shows that their exports to Germany increased by only 1.1%, Germany’s own data shows that Chinese exports to Germany rose by a third last year to 191 billion euros ($204 billion) and Germany ran a trade deficit of 84 billion euros ($90 billion) with China. These deficits help to explain why Germany is working so hard diplomatically to convince Biden administration officials to water down the domestic content rules for electric vehicles in the Inflation Reduction Act, passed by Congress last year.
The disparity between Chinese trade figures and other countries’ figures is not unusual. Part of it is likely due to how exports from Hong Kong are counted. Some nations include them in their China figures. Another distortion in the figures is in the Netherlands. It includes Europe’s largest port, Rotterdam, and what China counts as exports to the Netherlands likely includes billions of dollars of goods destined for other European locations.
China’s Shift to Electronics from Low-Tech, Labor-Intensive Goods
As China has grown, the types of goods it exports have shifted from labor-intensive goods such as apparel, footwear, and low-tech electronics to high-tech manufacturing of electronics and batteries.
As shown in Table 2, Nine of the top ten largest Chinese exports are electronics or electronic parts. The chapters for electronics (HS 84 and HS 85) account for $1.5 trillion, 42% of China’s exports in 2022. The top ten export chapters from China account for over two-thirds (67.2%) of its exports.
Table 2: China’s Top Exports in 2022
| Commodity (HTS Line) | 2022 Export Value (US Dollars, Billions) |
| Smartphones (85171300) | $138.8 |
| Portable data processing machines (84713090) | $96.9 |
| Other integrated circuits, as memories (85423290) | $66.4 |
| Lithium-ion electric accumulators (85076000) | $50.9 |
| Other integrated circuits, as processors and controllers (85423190) | $50.2 |
| Photovoltaic cells assembled in modules or made up into panels (85414300) | $42.4 |
| Tablet computers (84713010) | $30.8 |
| Toys (95030089) | $25.6 |
| Other integrated circuits (85423990) | $25.5 |
| Other apparatus for transmission/reception of voice, images or other data (85176299) | $24.5 |
Source: General Administration of Customs of the PRC
Textiles have seen a consistent decline in China’s share of exports as it has moved up the value chain of commodities. In 2017, the earliest data available, textiles ranked fourth and accounted for 3.2% of China’s imports that year. The export value of textiles has grown 8% since 2017, but it now ranks eleventh as other commodities have become an increasing share of China’s manufacturing.
The most recent data also shows China growing its manufacturing of more sophisticated goods. Vehicle exports grew by 25.3% in 2022 but remain a relatively small fraction of China’s overall exports at only $150.2 billion.
Trade Diversion: Increased Exports to Asia
If China continues decoupling from the U.S. market, it will continue to need other countries to absorb its excess production or face politically problematic stagnation. Its fastest growing trade counterparties are within Asia. In 2022, the ASEAN bloc increased by 18% and India increased by 22%. As Table 3 shows, China is becoming increasingly reliant on smaller economies in Africa, Asian, and Eastern Europe. The problem for China is that these economies are too small to fully replace the U.S. consumer market.
One of the reasons for increased trade particularly with Southeast Asia is the incentive that U.S. tariffs have created for trade diversion. As Chinese firms move production within Asia for export to the U.S., the likelihood for transshipment and the shifting of Chinese materials for manufacture of goods elsewhere increases. One such potential piece of evidence in China’s export data is the $793 million of semifinished steel (HS 7207) exports, up 2977% from 2021. Curiously, China had not previously reported semifinished steel exports exceeding $25 million in previous years.
China’s Economic Model Running Out of Momentum
While Zero-Covid policies remained in effect for most of 2022 and played some role in tampering down domestic consumption, the collapse of import growth is a result of weak domestic demand. Fundamentally, China is a middle-income country that is overly reliant on an export-oriented growth model. Such a model that comes at the expense of its trading counterparties as imbalances persist over decades, of which with the United States is the largest.
Given China’s weak domestic demand and faltering domestic real estate markets, China’s slower GDP growth makes them ever more dependent on exports. Yet, demand for Chinese exports among the developed world is weakening as the global economy slows. The choices that remain for China become limited once export-driven growth is no longer feasible. China’s record trade surplus is not a sign of a well-functioning economy, but rather one that has been built on an unsustainable model that may very well have reached its end.