
Friday’s employment data showed a slower than expected rise in non-farm payrolls, but the overall quality of those jobs has remained relatively flat. The good news is that over a three-month period, wages have eked out a 0.92% gain, based on today’s data from the Job Quality Index.
The index, created by researchers and economists from Cornell University and the Coalition for a Prosperous America stood at 81.99 again in April, which is precisely where it was in March. That index reflects a flat-lining in the proportion of U.S. production and non-supervisory (P&NS) jobs (non-executive compensation) paying less than the mean weekly income of all so-called P&NS jobs relative to those jobs paying above the mean. In other words, we are not seeing a rise in lower-skilled, lower-wage jobs added to payroll, and we are not seeing a rise in higher-wage, higher-skilled jobs added. It’s a wash.
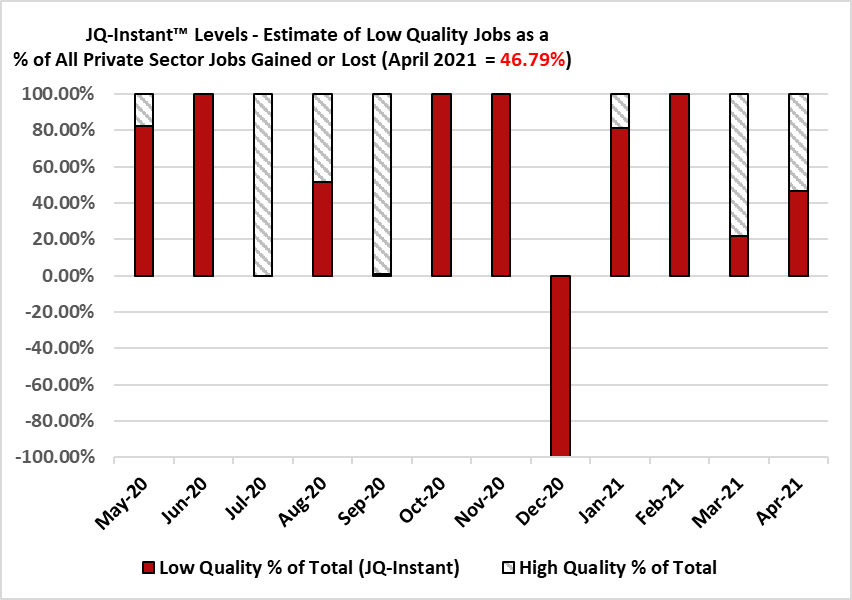
The JQI Index is based on a rolling three-month calculation.
The mean weekly wage income of all P&NS jobs as of April rose to $863.55 from $854.72 in March because there were fewer people returning to work in the travel and tourism sectors of the economy, keeping the gap between high and low paying jobs more in favor of the high end.
The JQ-Instant™ preliminary interpretation of the Bureau of Labor Statistics reported a gain of 266,000 jobs in the private sector in April tells us that 46.79% of the jobs were in industry sectors offering P&NS jobs with an average weekly income below the mean weekly income of all P&NS jobs (meaning lower-quality jobs). This shows that there has been a substantial, recent gain in the leisure and hospitality sector but that it remains in the minority. Higher quality jobs in professional and technical services and financial jobs, especially in the real estate sector, beat those jobs out.
 Income Up
Based on March’s wage data, the most recent for this type of study, these are some sectors that have seen their weekly wages rising above the mean for all P&NS jobs, which means non-executive level compensation.
Notice that demand from US factories is coming back as lockdown restrictions are increasingly being lifted and mining-related jobs are gaining, either as a response to increased electric power demand or for rare earths and related minerals used in making electric car batteries. We are seeing a shift here in minerals being used as energy.
Sector Mar 2020 Jan 2021 Feb 2021 Mar 2021
HVAC, commercial refrig manufacturing $876.88 $976.33 $979.33 $1,015.82
Engine, turbine manufacturing $1,183.42 $1,309.48 $1,370.79 $1,317.14
Mining $1,421.26 $1,507.45 $1.499.89 $1,574.91
Income Down
Here are some of the biggest losers on an annualized basis in terms of weekly income in the manufacturing sector. Oil and gas and utility system construction could be the impact of layoffs due to the Biden administration’s decision to pause new oil and gas drilling on federal lands, and stopping a Keystone pipeline project that would connect the American Midwest to Alberta, Canada.
Sector Mar 2020 Jan 2021 Feb 2021 Mar 2021
Logging $941.41 $929.82 $901.52 $869.03
Oil and gas $1,657.88 $1,585.49 $1,589.25 $1,569.59
Utility system construction $1,373.27 $1,291.21 $1,259.48 $1,304.33
JQI data is on non-supervisory roles only, or PN&S. The total number of PN&S jobs as of March 2021 stood at 99.7 million, of which 44.8 million were paying above the average weekly wage for all P&NS jobs. That is a 4.8% increase over the same period last year, but not enough to make up for the higher number of lower-wage positions in the American job market.
Companies are also having a harder time filling open positions in manufacturing and in some service sector jobs thanks in large part to extended unemployment benefits. This also makes it harder for small and mid-sized businesses to grow as a smaller labor force also often means lower production and lower sales.
About the JQI Index
The JQ-Instant calculation utilizes 123 sectoral categories, in contrast to the 180 used in the main JQI itself, because of a one-month delay in the Bureau of Labor Statistics reporting of more granular data.
The JQI analyzes a representative sample of the economy using production and non-supervisory job data from 180 different industry groups spanning across all 20 super-sectors into which the BLS groups establishments. The principal data utilized is contained in the Current Employment Survey (CES), P&NS data on average weekly hours, average hourly wage and total employment for each given industry group (seasonally adjusted, in all cases).
The JQI is updated on a monthly basis with the release of new CES data from the Bureau of Labor Statistics and is used to produce the Quality Job Benchmark. The benchmark value is indicated by the average weighted weekly wage within the set of 180 industry groups, and weighted for the number of jobs in each group.
On Friday, the Bureau of Labor Statistics reported total nonfarm payroll employment rose by 266,000 in April, and the unemployment rate rose within a margin of error to 6.1% as the U.S. economy continues to claw its way out of the pandemic.