With jobs being added back to the U.S. economy after nearly a year of economic restrictions, higher paying wages are leading to an improvement in the Job Quality Index.
The index, created by researchers and economists from Cornell University and the Coalition for a Prosperous America hit 81.99 in March, up by 0.48% from its revised level in February. The rise reflects a smaller proportion of U.S. production and non-supervisory (P&NS) jobs (non-executive compensation) paying less than the mean weekly income of all so-called P&NS jobs relative to those jobs paying above the mean.
The JQI Index is based on a rolling three-month calculation.
The mean weekly wage income of all P&NS jobs as of March (which reflects the wage levels as of January 2021) fell to $854.72, a change of -0.88% from its revised level the month prior. The downward change in this series is indicative of a mass return of low-wage/low-hours positions back to the workforce. As there are more of them returning to work over the past three months compared to higher paid office workers and management positions, the wage averages shrink.
However, the JQ-Instant™ preliminary read of the 780,000 gain in all private sector, non-farm payrolls for March 2021 shows that only 34.72% of such gain in private sector jobs were in industry sectors offering lower paying wages below the mean weekly income of all non-executive level P&NS jobs. This is a good sign and is due to the gain in March of the more than 183,000 jobs in manufacturing. These better paying jobs in March, as measured by the JQ-Instant Index, accounted for 65% of new private sector jobs either returning to work or new hires.
Income Up
Based on February’s wage data, the most recent for this type of study, these are some sectors that have seen their weekly wages rising above the mean for all P&NS jobs, which means non-executive level compensation.
Notice that some of the top three gainers versus a year ago were pandemic related, whether it was a textile mill working overtime on mask making, or furniture companies seeing more demand from home-bound workers and people spending stimulus checks.
Sector Feb 2020 Dec 2020 Jan 2021 Feb 2021
Textile manufacturing $746.81 $855.62 $852.35 $852.39
Furniture manufacturing $741.08 $774.80 $787.03 $781.95
Building materials $659.11 $746.59 $757.80 $746.53
Income Down
Here are some of the biggest losers on an annualized basis in terms of weekly income. The local yoga instructor and area nightlife/bars are in the worst shape.
Sector Feb 2020 Dec 2020 Jan 2021 Feb 2021
Florists $395.56 $362.79 $364.08 $361.85
Personal care/wellness $449.79 $405.04 $424.10 $400.32
Bars $360.94 $318.89 $326.67 $325.48
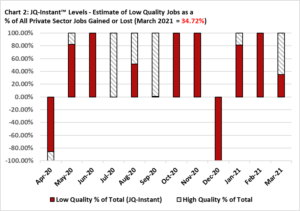
The above chart shows exactly where would like to see the jobs data trending: more high quality jobs as a percentage of private sector employment than lower quality, lower wage jobs.
About the JQI Index
The JQ-Instant calculation utilizes 123 sectoral categories, in contrast to the 180 used in the main JQI itself, because of a one-month delay in the Bureau of Labor Statistics reporting of more granular data.
The JQI analyzes a representative sample of the economy using production and non-supervisory job data from 180 different industry groups spanning across all 20 super-sectors into which the BLS groups establishments. The principal data utilized is contained in the Current Employment Survey (CES), P&NS data on average weekly hours, average hourly wage and total employment for each given industry group (seasonally adjusted, in all cases).
The JQI is updated on a monthly basis with the release of new CES data from the Bureau of Labor Statistics and is used to produce the Quality Job Benchmark. The benchmark value is indicated by the average weighted weekly wage within the set of 180 industry groups, and weighted for the number of jobs in each group.
On Friday, the Bureau of Labor Statistics reported total nonfarm payroll employment rose by 916,000 in March, and the unemployment rate edged down to 6% as the U.S. economy continues to claw its way out of the pandemic.
For more information about how the JQI is calculated, click here.
About the Coalition for a Prosperous America
The Coalition is a non-profit organization advocating for American, domestic manufacturing companies and its labor force with a focus on critical supply chain realignment.