U.S. Trade Policy: Over Half a Century of Unreciprocated Tariff Cuts
By Amanda Mayoral, CPA Economist
Summary Points:
- The US held high tariff rates from 1816 until the middle of the 20th century
- The US then cut tariffs more than most countries, often unilaterally, without also requiring tariff reductions by others
- Today, the US has one of the lowest tariff rates among WTO members, and by far the lowest among large importing countries
- Given the volume of imports and low tariff rates by the US, businesses and workers are subjected to more import displacement than any other country. These pressures are tied to outsourcing jobs, declining wages, and a long-term trade deficit
- Product-level tariff rates for the US are also relatively low
- Low tariff rates encourage import competition. The economic literature shows the large negative effect of import competition on manufacturing jobs, wages, and worker displacement
Introduction
Between 1816 and 1947, the US adopted an average tariff rate on dutiable imports of about 37%, with the highest rate reaching 60%. Since that date, the US has reduced tariffs more aggressively than almost any other nation, now maintaining an applied MFN rate of 3.4% as documented below. The effect of the low tariffs has been to accelerate imports into the US. Economic research has found that imports have reduced manufacturing employment and wages, with related negative social effects. This article contrasts current US tariff levels with those of other nations.
Historical US Tariff Rates
The US has historically had a high tariff rate on imports from other countries. To summarize the history of US tariff rates, the timeline below outlines the major events.
Figure 1: History of US Tariff Rates 1789-2000
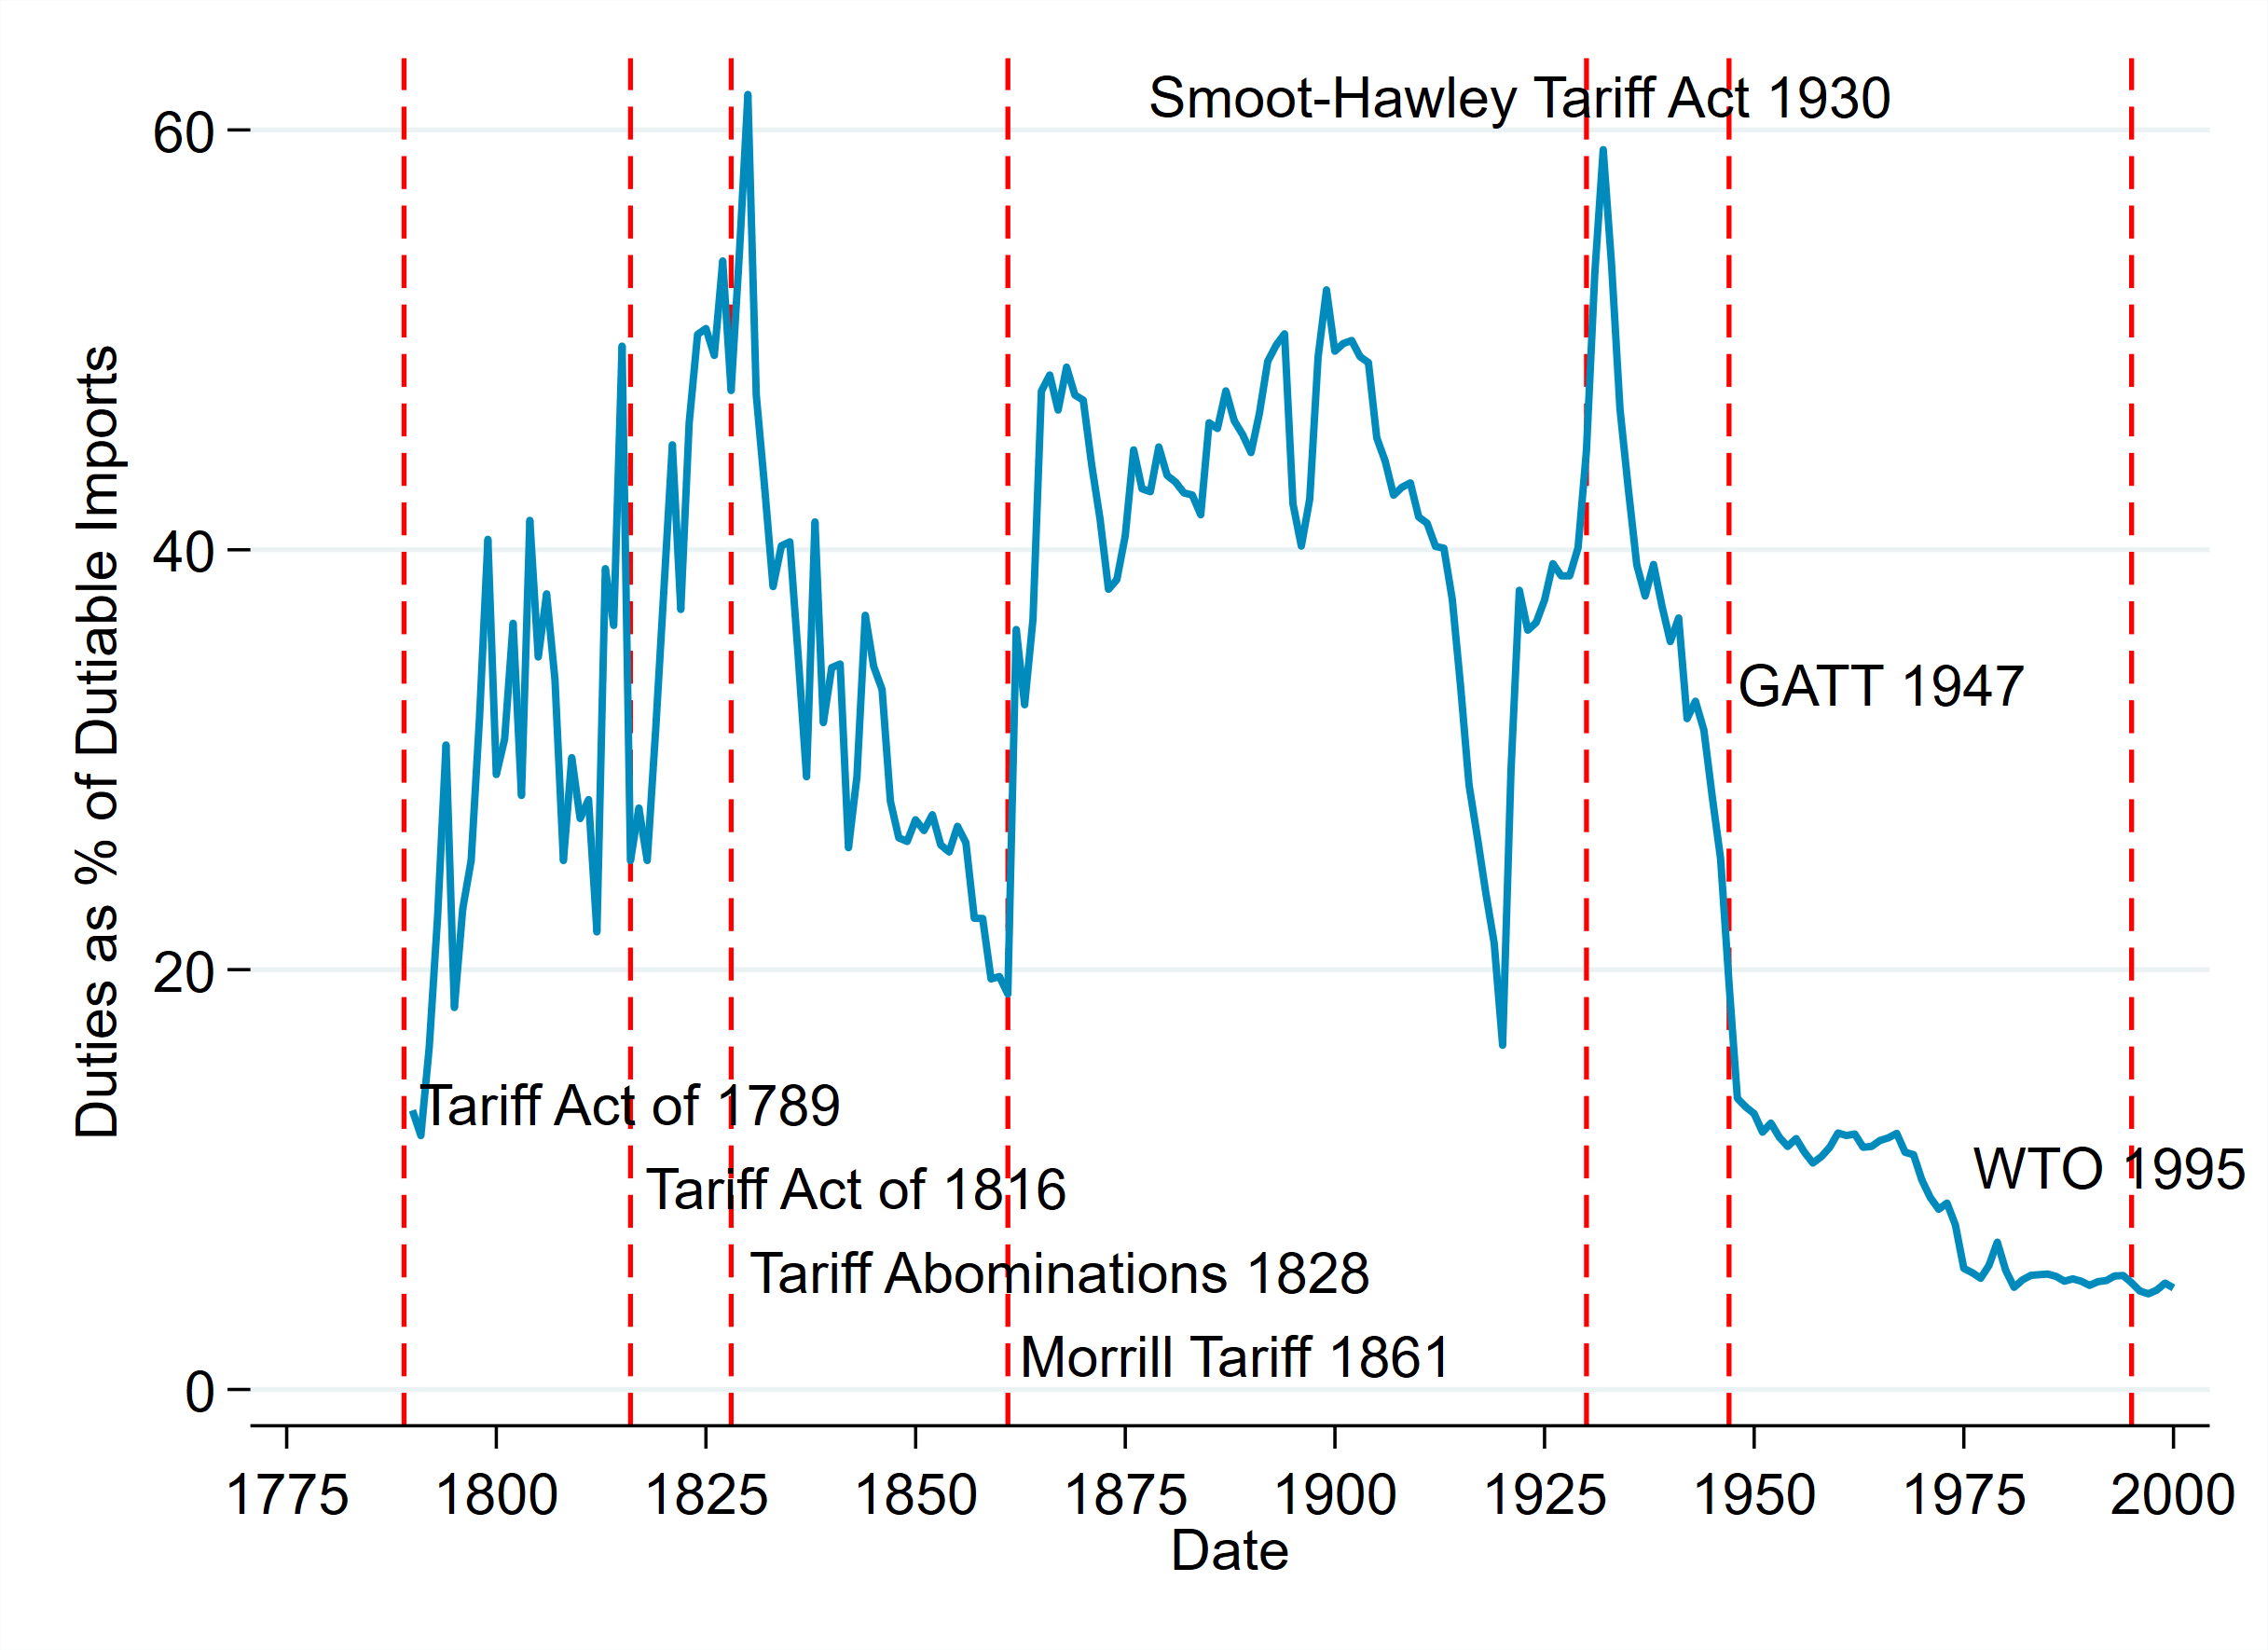
Data from 1790-1820: Douglas Irwin, “New Estimates of the Average Tariff of the United States, 1790-1820”, NBER Working paper No.9616, April 2003. Data from 1821-2000: Douglas Irwin, “Merchandise imports and duties: 1790–2000.” Table Ee424-430 in Historical Statistics of the United States, Earliest Times to the Present: Millennial Edition, edited by Susan B. Carter, Scott Sigmund Gartner, Michael R. Haines, Alan L. Olmstead, Richard Sutch, and Gavin Wright. New York: Cambridge University Press, 2006.
Beginning in earnest with the Tariff Act of 1816, Congress looked to tariffs not just for revenue, but also to grow domestic industries. This was not a uniform view, and many strong agricultural interests rejected so-called ‘protective tariffs’ because they typically meant less export-market access for their goods. In 1828, congress passed the highest level of tariffs in US history to protect US industries from foreign competition, particularly British. Over the next few decades, political pressures drove down tariff rates until 1861. At this time, the balance of power in Congress shifted when the south seceded, allowing congress to again raise tariff rates with the 1861 Morrill Tariff act.
There were a few more key pieces of legislation that followed in the 20th century. The last time Congress enacted a revised tariff schedule was in 1930 with the Smoot-Hawley Tariff Act. This act raised tariff rates to their second highest level in history, allowing average tariff rate on dutiable imports to reach up to 60%. The timing of the legislation came shortly after the beginning of the Great Depression, leading many to speculate that the act exacerbated the effects of the Great Depression. However, economic research on the subject has showed that the 1930 act was in fact expansionary.[1] Lastly, the US began its longest period of low tariffs in 1947 by signing onto the international General Agreement on Tariffs and Trade (GATT) to reduce tariffs and non-tariff barriers globally. This agreement was further formalized in 1995 with the creation of the World Trade Organization (WTO).
The creation of the GATT and the WTO have introduced new global tariff rules such as the most favored nation (MFN) tariff. A MFN tariff is a non-discriminatory tariff rate by one country that must be offered to all WTO member countries. However, other nations do not need to match one nation’s MFN tariff rates. That is, a WTO member must treat all other WTO members equally, or at least as good as their “most favored nation,” but other nations can maintain their own higher MFN rates. For instance, if the US lowers tariffs for Canada to 1%, it must also offer this lower tariff to all other WTO members, aside from trade deals. This means that the US can’t charge a higher tariff to any other WTO member country. This doesn’t stop Canada, however from setting higher tariff rates. The next section shows how the US has one of the lowest MFN rates globally.
Current U.S. Tariff Rates vs. Rest of the World
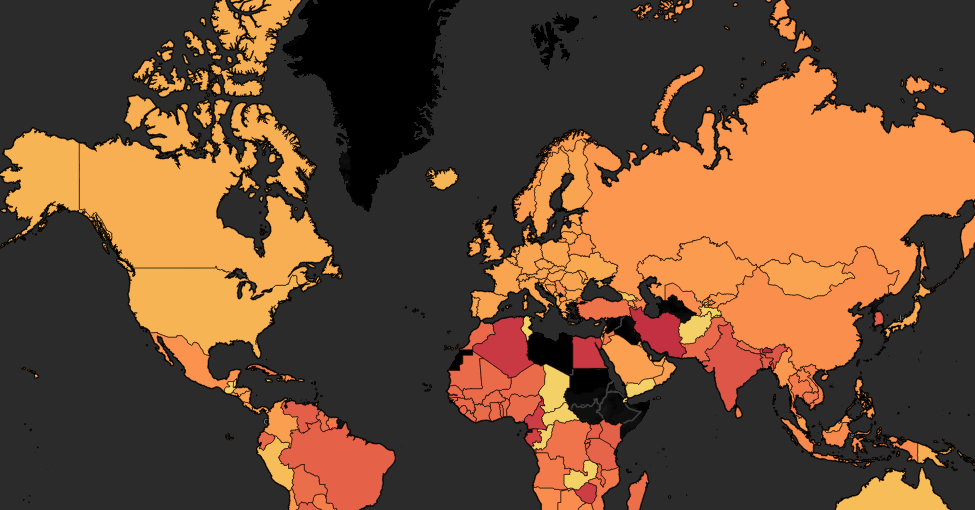
Unlike most of its history, the US now has one of the lowest MFN tariff rates globally (11th lowest tariff comparatively). In 2021, the average MFN tariff rate for the US is only 3.4% on a simple average basis, as shown in table 1 below. What is surprising to see is that the US MFN rate is notably less than other major economies and less than half of the world average rate of 8.9%.
Table 1: MFN Tariff Rates and Imports for Select Countries
| MFN Tariff % | Imports (Billions USD) | |
| USA | 3.4 | 2387.2 |
| EU | 5.1 | 2055.5 |
| Mexico | 7.1 | 417.2 |
| China | 7.5 | 1927.7 |
| Korea | 13.6 | 486.8 |
| India | 15 | 476.8 |
| World Avg. | 8.9 | 120.0 |
Source: UNCTAD, World Tariff Profiles, 2021
The US has 18% of all world imports ($2,387 billion) in 2020 and yet has one of the lowest tariff rates globally. The next closest comparator, the EU, imports 86% as much as the US but has a 50% higher tariff rate. China has 80% as many imports as the US but charges a 341% larger tariff rate. Finally, the world average has a tariff rate that is more than twice as large as the US. Together, these data demonstrate that the US is the most subjected country to import pressures. That is, US domestic industries face the most competition globally against the largest and cheapest amount of imports. This competition has led to an outsourcing of cheaper jobs and a rising trade deficit for decades, discussed in the next section.
Next, look at the pattern of tariff rates applied at the product-level in figure 2 below. The pattern in MFN rates at the product-level is the same in the aggregate-level: the US offers much lower rates than most countries. For instance, manufacturing of food items such as cereals or other preparatory goods are tariffed at 32.9% by India, 19.5% by China, and only 3.1% by the US.
Figure 2: MFN Tariff Rates and Imports for Select Countries/Industries
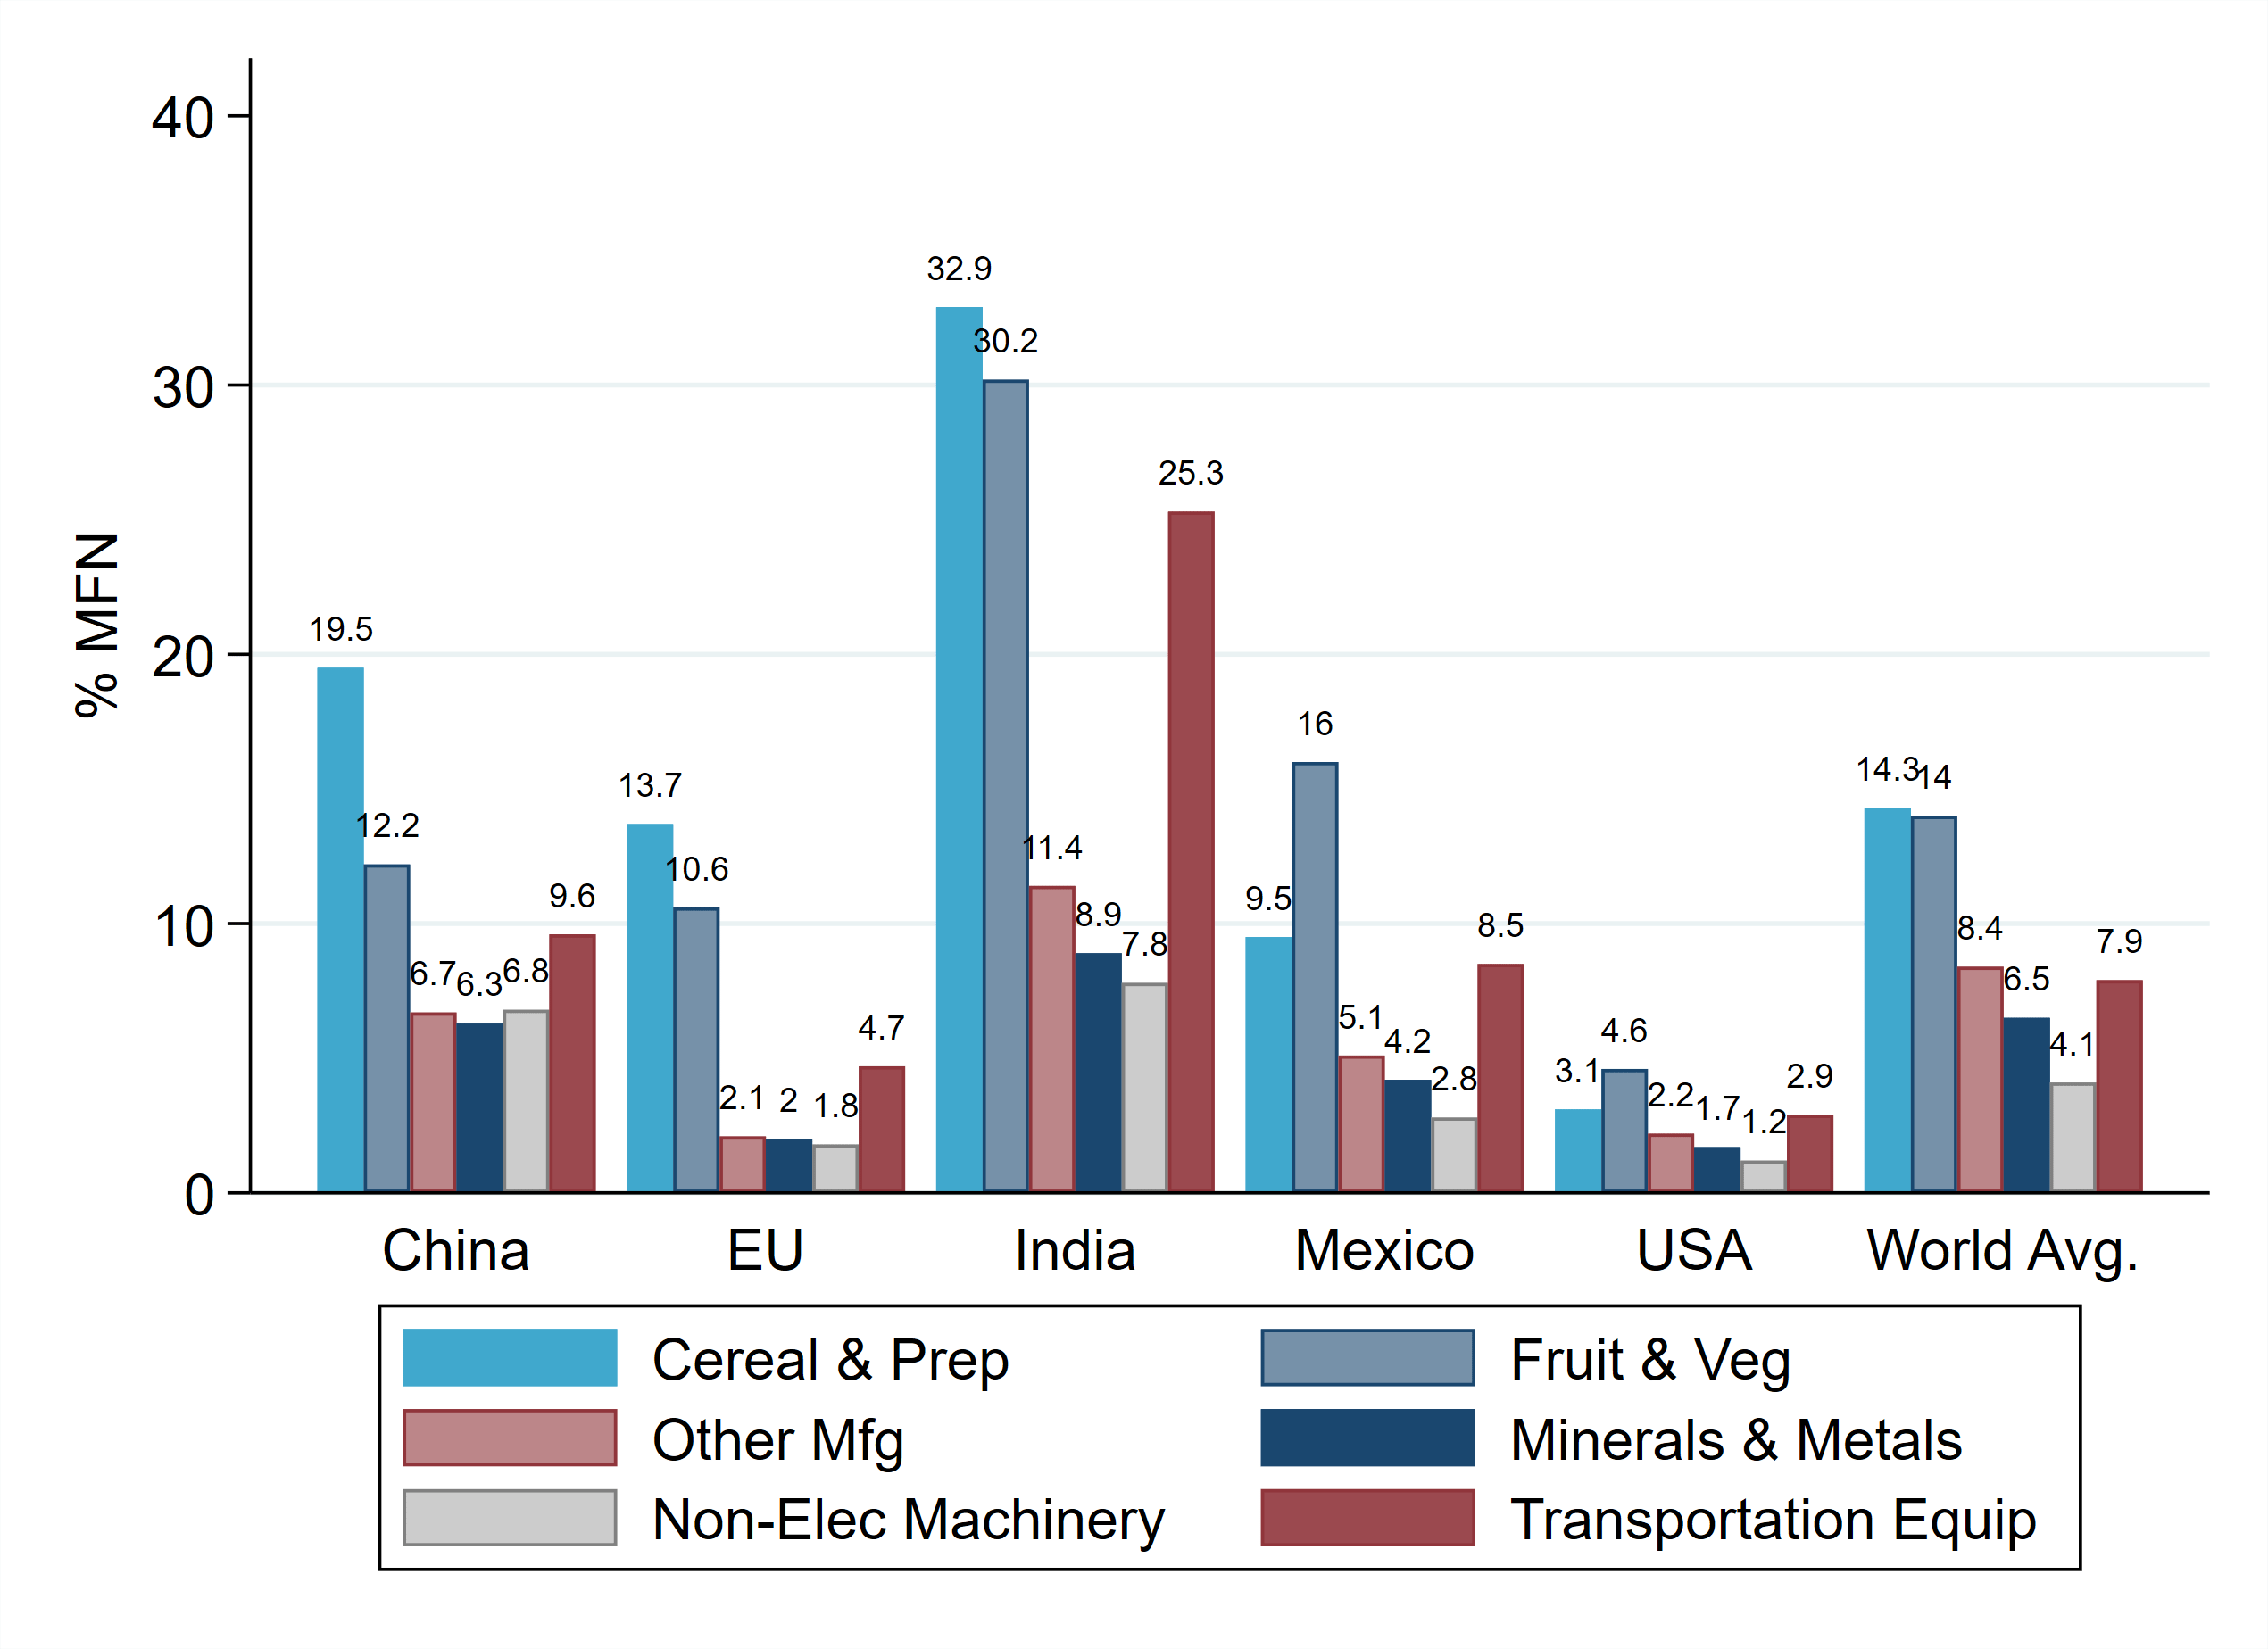 Source: UNCTAD, World Tariff Profiles, 2021
Next to the US, the EU also has low tariff rates for some products. However, unlike the EU, double-digit tariff rates are uncommon for the US. Mexico, one of the US’s largest trading partners, charges more than double the amount of tariffs for imported goods. Figure 2 also shows that the US has significantly lower tariff rates compared to the global average. Overall, Figure 2 demonstrates that the applied tariff rate varies significantly across countries and products. Many countries adopt higher rates to protect and help develop their own industries. Unlike other countries, the US tends to uniformly and non-strategically adopt low tariff rates irrespective of industry.
Global Map of Tariff Rates
A global comparison of the average MFN rates is shown in figure 3 below. Darker orange and more red colored countries have higher tariff rates. The US, along with Canada and Australia, have among the lowest in the world. Asian countries have higher MFN rates, while African and middle eastern countries have the highest. The EU has the same rate of 5.1%.
Figure 3: Distribution of Tariff Rates Globally
Source: UNCTAD, World Tariff Profiles, 2021
The Consequences of Low US Tariff Rates
Low tariff rates increase imports which cost jobs and wages. This is because increased imports compete with domestic businesses and workers. Imports from countries like China are cheaper than US goods, primarily because labor is cheaper and regulatory compliance costs are lower. Working conditions in China are often inhumane, at times using child or slave labor to produce cheaper goods.[2] This means that US workers who try to earn a living wage are competing with the extremely low wages of workers in China. Effectively, US worker wages have declined in industries that compete with Chinese imports. Lower tariff rates make it easier to import. Therefore, the significant drop-in tariff rates by the US have negative consequences on US workers and the US industrial base.
There are several empirical papers that have measured the negative effect of import competition on US jobs and wages. Research by Autor, Dorn, and Hanson show that imports from China were responsible for a quarter of all manufacturing job losses between 1990 and 2007.[3] Empirical research on the more recent effects find similar results. For instance, research by Acemoglu, Autor, Dorn, Hanson, and Price find that Chinese imports are responsible for up to 2.4 million job losses between 1999-2011.[4]
Other research by Leonardi and Meschi shows a $1000 increase in per-worker import exposure causes a decrease in manufacturing employment by 0.74 percentage points. They also find that protection measures, particularly non-tariff barriers, increase manufacturing employment. Lastly, the authors find that import exposure hurts non-skilled manufacturing jobs nearly five times as much as high-skilled jobs.
Import competition not only reduces the number of jobs but also decreases the quality. Research on the worker-level effects, such as worker displacement, shows that displaced workers tend to take lower-paying jobs after losing their manufacturing job. For instance, research by Autor, Dorn, Hanson, and Song show that workers affected by rising imports experienced lower wages and were subsequently more likely to apply for disability benefits. The impact of import competition tends to be worse for low-wage workers than higher-wage or more skilled ones. Further, manufacturing workers who lost their job were unlikely to find a similar job and were also more likely to have a hard time keeping subsequent jobs.[5]
Economic research has also found that the impact on Black workers is more severe than on white workers. This is because Blacks have been more dependent on manufacturing as a route to middle-class incomes than whites. Research by Gould found that the decline in US manufacturing employment since 1960 reduced Black male wages by 13.3% and increased the male Black-white wage gap by 12%.[6] Similarly, worker dislocation rates are higher among minorities, women, and older workers as reported by the Bureau of Labor Statistics. Lastly, a recent report by the USITC found that the cumulative effect of trade agreements has favored non-manufacturing and college educated workers. They also find that the manufacturing sector lost jobs while the services sector gained jobs. They also show that trade agreements favored jobs for male over female workers.[7]
Conclusions
Despite a long history of using protective tariffs, the US is now one of the lowest tariff setting countries in the world. The goal of low tariffs is to increase competition and reduce prices. However, the US has also achieved major job and income losses. The US’s tariff setting strategy is unlike any other. While most countries raise tariffs on certain industries to help them develop over the longer-term, the US has almost unilaterally applied a low-tariff rate. These low tariff rates put the US businesses and workers in the worst position globally. They are essentially the most subjected to import pressures, which has resulted in millions of job losses and a long-term depression of wages and workers displacement.
Most observers mistakenly believe that the free trade doctrine of bringing all tariffs and non-tariff barriers down was equally achieved among all parties. However, in practice the low tariff rates set by the US were not conditioned upon reciprocal reductions by trade competitors and therefore have not been reciprocated. This means that most countries are enjoying a larger domestic market share for their goods and asymmetrical market access, at the cost of US businesses and workers. The US should engage in a more strategic tariff setting strategy that is less idealistic in doctrine and more realistic in its effect on US interests.
[1] Barry Eichengreen, “The political economy of the Smoot-Hawley tariff”, NBER, 1986
[2] Kerry Picket, “Uyghur refugee: U.S. must stop buying Chinese slave labor products”, The Washington Times, September 23 2021
[3] David Autor, David Dorn, and Gordon Hanson, “The China Syndrome: Local Labor Market Effects of Import Competition in the United States”, American Economic Review, 2013, 103(6): 2121–2168
[4] Daron Acemoglu, David Autor, David Dorn, and Gordon Hanson, “Import Competition and the Great U.S. Employment Sag of the 2000s”, Journal of Labor Economics, 34(S1), pg. S141–S198
[5] David Autor, David Dorn, Gordon Hanson, and Jae Song, “Trade Adjustment: Worker Level Evidence”, Quarterly Journal of Economics, 129(4), 1799–1860
[6] Gould, Eric, “Torn Apart? The Impact of Manufacturing Employment Decline on Black and White Americans”, IZA Institute of Labor Economics, Discussion Paper No. 11614, June 2018.
[7] USITC, “Economic Impact of Trade Agreements Implemented Under Trade Authorities Procedures”, 2021 Report