America’s international debt continues to grow. According to the federal government’s Bureau of Economic Analysis, our international debt, referred to in government data as Net International Investment Position (NIIP) reached negative $16.1 trillion at the end of 2022, in other words a debt of just over $16 trillion to foreigners. This is equivalent to 69% of our GDP, or on a per capita basis, $50,728 of foreign debt for each American.
Our NIIP grows (i.e. gets more negative) as we continue to run the world’s largest current account deficit, piling up more debt to foreigners each year. The current account deficit is made up of the trade deficit plus some smaller international flows such as investment income. When a nation has a positive NIIP, i.e. more foreign assets than debts, it is a sign of strength. Conversely, it’s a sign of weakness when a nation owes more money to foreigners than it has foreign assets.
In 2022, our NIIP improved by $2 trillion in spite of our record $943.8 billion current account deficit last year. The improvement, from -$18.1 trillion to -$16.1 trillion, was due to the fall in value of many U.S. stocks and bonds in 2022. This reduced the value of U.S. foreign liabilities. Our foreign assets consist of the holdings by Americans of foreign stocks and bonds and the foreign subsidiaries of American corporations. Our foreign liabilities are the holdings by foreigners (individuals, industrial companies, investment firms and foreign governments) of U.S. companies, stocks or bonds. The difference between the two is the NIIP, the net international investment position.
The improvement in 2022 reflects the short-term movements in prices and values of securities. As long as we continue to run current account deficits, the long-term trend is for our NIIP to continue to deteriorate.
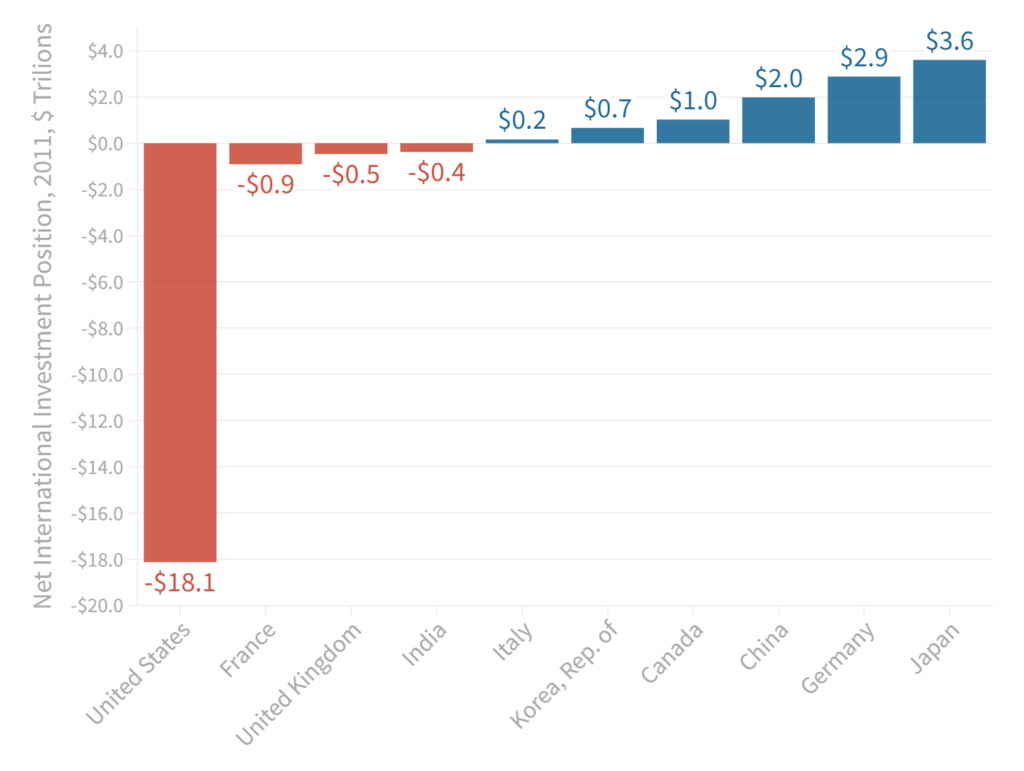
The International Monetary Fund (IMF) publishes NIIP figures for all member nations. Since most nations have not yet reported their 2022 figure to the IMF, we focus below on the 2021 data. For 2022, as for 2021, our NIIP stands out as the world’s largest negative NIIP, whether on a total or a per capita basis.
Figure 1. The U.S. NIIP is the world’s largest negative NIIP (2021 data)
Our NIIP has been growing at an alarming rate. As you can see in Table 1 below, it was just $7.8 trillion in 2017. It has more than doubled in just five years as the U.S. chalks up year after year, the largest current account deficits in history. The trade deficit is the major driver of the negative current account balance. With a trade deficit approaching $1 trillion last year, the only way we can finance all those imports is by selling securities to foreigners. So each year we increase our debt as a nation, owing trillions of dollars to foreigners.
Table 1. Net International Investment Position, World’s Major Nations, 2017-2021
| NIIP 2017 | NIIP 2018 | NIIP 2019 | NIIP 2020 | NIIP 2021 | % change, 2017-21 | |
| Japan | $2916.6 B | $3080.4 B | $3270.5 B | $3422.1 B | $3600.1 B | 23% |
| Germany | $1733.8 B | $2014.5 B | $2284.5 B | $2680.0 B | $2882.8 B | 66% |
| China | $2065.2 B | $2107.5 B | $2299.6 B | $2286.8 B | $1983.3 B | -4% |
| Canada | $579.2 B | $449.7 B | $472.7 B | $744.7 B | $1016.7 B | 76% |
| South Korea | $261.7 B | $436.2 B | $517.8 B | $487.2 B | $659.6 B | 152% |
| Italy | -$153.1 B | -$101.1 B | -$23.4 B | $27.6 B | $164.4 B | -207% |
| India | -$426.7 B | -$433.9 B | -$430.3 B | -$352.0 B | -$377.0 B | -12% |
| United Kingdom | -$94.2 B | -$83.5 B | -$314.0 B | -$515.8 B | -$465.8 B | 395% |
| France | -$554.2 B | -$521.5 B | -$674.1 B | -$870.5 B | -$908.2 B | 64% |
| United States | -$7830.7 B | -$9795.8 B | -$11653.1 B | -$14707.4 B | -$18124.3 B | 131% |
| Source: IMF, CPA calculations | ||||||
The three nations with large positive NIIPs, Japan, Germany and China, hold substantial amounts of U.S. securities in their central bank balance sheets. These nations run persistent trade surpluses that increase their productive power.
Another way to look at NIIP is to see how much it works out per head of population. Table 2 below shows that the U.S. has the worst NIIP per person, at negative $50,728 per person at end- 2021. That means that each American effectively owed $50,728 to foreign investors. (Table 2 includes the U.S. figure for 2021, for consistency with other nations.) The only nations in the same ballpark are the European Union victims of the 2011 EU debtor crisis, when the weakest members of the EU, Portugal, Italy, Greece and Spain, suffered from excessive deficits and near-failure of their government bond markets. The European Central Bank bailed them out by buying their government bonds and defending the euro currency. Italy has erased its negative NIIP by sacrificing GDP growth to achieve a current account surplus. The other so-called “PIGS” nations still have substantial negative NIIPs.
Table 2: Net International Investment Position per Person, Selected Nations (end-2021)
| NIIP per person (2021) | |
| Major Economies | |
| Germany | $34,651 |
| Japan | $28,645 |
| Canada | $26,582 |
| South Korea | $12,746 |
| Italy | $2,781 |
| China | $1,404 |
| India | -$268 |
| United Kingdom | -$6,918 |
| France | -$13,406 |
| United States | -$54,609 |
| EU Debtor States | |
| Spain | -$20,625 |
| Portugal | -$22,279 |
| Greece | -$33,242 |
| Source: IMF, CPA calculations | |
History teaches us that foreign debt has often played a role in the collapse of great empires. The Spanish Empire thrived in the early 1500s as gold and silver poured in from its colonies in Latin America. Spain was the world’s most powerful empire and luxurious living abounded in the capital Madrid, trading center Medina, and Seville, the port by which the gold and silver arrived. But the wealth made the Spanish elite lazy and it failed to keep up with economic progress in its European rivals. King Philip II carried on a series of wars financed with foreign loans until finally in 1595, the Spanish treasury was empty, his troops were exhausted, and the King of Spain declared bankruptcy. It was the beginning of a decline which would last 300 years.
In the 20th century, the British Empire went through a similar process. It had a large positive international investment position in 1914 but two world wars forced it to sell its overseas assets. By 1945, it was dependent on American loans to buy the imports it needed to feed its people. In 1956, Britain, in partnership with France and Israel, invaded the Suez Canal to take it back from Egypt. President Eisenhower objected to the use of force. In a historic phone call, he threatened to cancel the British loan. The British prime minister ordered his generals to turn around and retreat. Britain withdrew from Suez and the British Empire was effectively at an end.
One historian argued that Spain’s biggest failing was to ignore the production potential of its domestic economy. “The massive wealth procured from America allowed the Spanish monarchs and minister to throw money at every problem that arose, but it gave the country no incentive to evolve its own internal economy.”[1]
This comment has eerie parallels to the modern U.S. We do not have access to silver and gold, but we enjoy capital inflows from the rest of the world which sustain a high volume of consumption and a huge trade deficit. The capital inflows are purchases of U.S. stocks and bonds by foreign investment firms, central banks, sovereign wealth funds, and other investors. These capital inflows raise the dollar to a level of overvaluation that makes our industry uncompetitive and reduces the profitability of family farming. The overvalued dollar makes our exports less competitive and allows foreign producers to sell at lower prices in our market, taking away market share from domestic producers. Our manufacturing industry declines, prompting us to import more, creating a vicious cycle of deindustrialization and the loss of good, middle-class jobs. In agriculture, the overvalued dollar makes our exports of products like corn and soybeans less competitive compared to major competitors like Brazil, whose costs, denominated in local competitive currencies like the Brazilian real or the Argentine peso, are lower. So U.S. farmers get squeezed between high production costs and tougher competition in the global market.
Other effects of persistent deficits and a negative NIIP include the dependence on foreign imports for vital goods including pharmaceuticals, components that go into weapon systems, and the everyday items used in hospitals like masks and gowns, that can suddenly be hard to find when a pandemic strikes. All of these dependencies add up to a grave danger to our national security.
The solution is to prioritize eliminating our trade deficit, move the dollar to a competitive level, and invest in manufacturing industry at home, including plant and equipment and employee training. If we begin to invest and turn around the deficit, we will see a rise in production at home, more middle-class jobs, more training of employees to staff these jobs. In short, we can turn the vicious cycle into a virtuous cycle.
Until we do this, the NIIP will continue to grow. It is a ticking time bomb.
This article also appears on the website of the Blue Collar Dollar Institute:
https://bluecollardollarinstitute.com/reports/2023/04/17/u-s-international-debt-has-doubled-in-five-years-to-over-50000-for-each-american/
Footnotes
[1] Lundqvist, Tobias, “The Decline of Spain,” 2017. See here.