Summary
- Annual U.S. Census report on incomes reveals that household median income fell slightly and inequality widened in 2021
- Inequality and the shrinking size of the middle class have persisted in the U.S. for half a century.
- These trends are driven by globalization and the decline of U.S. manufacturing as a share of GDP.
- Inflation-adjusted wages of male hourly U.S. workers have fallen in the last 42 years.
- Depressed wages for production workers have contributed to the growth of the share of the adult population that has dropped out of the labor force, also known as the “un-working.”
- Increasing inequality has led to growing racial inequality, a larger gap between the median household income of Black and White households.
- Growth in the manufacturing sector, leading to increasing GDP growth rate, is the most powerful and persistent way to address inequality and income stagnation.
Income inequality is getting worse. That’s what the evidence in the latest report from the U.S. Bureau of the Census shows. Last month’s annual report on U.S. incomes in 2021 shows that inequality increased again, at the same time that U.S. household median income dropped slightly. And 2021 was an economic recovery year. It’s not a good omen, considering that so far this year, the U.S. economy has shrunk.
The 2021 Census report confirmed the trend in recent decades for the upper-income part of the population to enjoy rising real incomes while the middle and lower sections see stagnant or declining real incomes. The failure of the U.S. economy to deliver upward mobility for the majority of its citizens reflects the decline of middle-class jobs, in particular the decline of manufacturing jobs which have historically been the leading route into the middle-class for millions of Americans.
The new Census report confirms trends seen in another important report, by the Pew Research Center which found that the U.S. middle class is shrinking. That report, published in April 2020, How the American middle class has changed in the past five decades, analyzed federal government data and found that the middle class fell from 61% of the U.S. population in 1971 to 50% in 2021. The report also found that:
“The shrinking of the middle class has been accompanied by an increase in the share of adults in the upper-income tier – from 14% in 1971 to 21% in 2021 – as well as an increase in the share who are in the lower-income tier, from 25% to 29%”.
For the past 250 years, the U.S. has differed from other nations by having a large middle class. The shrinking middle class and the disappointingly low economic growth rate since the year 2000 lead to a reduction in living standards and economic opportunity for the lower-tier sections of the income distribution. It also feeds into the growing political polarization in our society.
The new Census report found that inflation-adjusted (“real”) median household income fell in 2021 by $402 or 0.6% to $70,784 at 2021 prices. This is a disappointing figure, as the post-pandemic return to work in 2021 should have led to rising median income with more people working and earning more money. While the median pay of all workers rose by 4.6%, the inflation-adjusted pay for those who worked full-time year-round decreased by 4.1%. The net effect was the fall of 0.6% for the entire U.S. workforce. Inflation averaged 4.7% in 2021.
Inflation eats into the real earnings of any worker who cannot get a pay increase exceeding the rate of inflation. Higher-income earners are more successful at staying ahead of inflation, either because their pay is linked to profits or bonuses, or they are in a stronger negotiating position than low-income earners. According to Wall Street firm S&P Global, companies in its S&P500 stock index, including the largest firms on U.S. stock markets, paid out dividends totaling $511.2 billion in 2021, up 5.8% on 2020, just ahead of inflation. Among production workers, higher-income workers generally do better than lower-income earners. For example, workers at farm equipment maker John Deere won a 10% pay increase last October after rejecting Deere’s 5% offer and threatening to strike. Deere workers are in the United Auto Workers. Non-unionized workers (90% of U.S. workers) are in a weaker position and less able to win such inflation-beating pay increases.
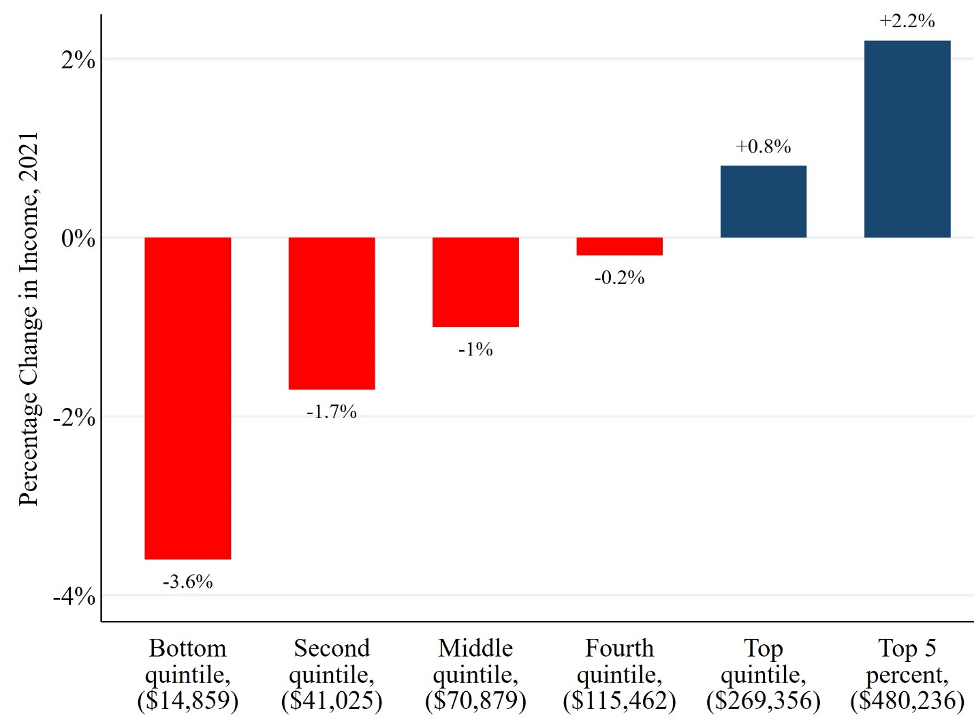
The growing inequality of 2021 household income data comes through clearly when the U.S. population of 129 million households in 2021 is divided into quintiles, or fifths. Each fifth contains 25.8 million households. The bar graph below shows the 2021 change in real income for each quintile, with the quintile’s average annual income in parentheses on the X axis. Last year continued the trend in earlier years where the higher income groups did much better than the middle or lower income groups.
Figure 1. Change in real income 2021 for U.S. households by quintiles and top 5%
Another perspective on growing inequality comes from the Census analysis of 2021 income changes by level of educational attainment. For households where the main householder has a bachelor’s degree or higher, income rose 2.7% to $115,456 in 2021. For households with “some college” income fell 4% to $64,378. For households with “High school, no college” income rose 0.9% to $50,401. For households with “No high school diploma” income fell 2.4% to $30,378.
Figure 2 shows the evolution of real average household income over the 54 years since 1967. The trend of the top quintile taking the vast majority of the gains generated by the U.S. economy began in the 1980s, accelerated in the 1990s, and has dominated the U.S. economy since recovery from the 2008 recession began around 2010. The top 5% benefited even more than the top 20%. For the bottom three quintiles (60% of the U.S. population), household income growth has been close to stagnant for the 21 years since 2000, the peak year of the late 1990s mini-boom. In those 21 years, the bottom quintile suffered real income decline of 7.3% (see Table 1 below). Only the top two quintiles posted double-digit percentage growth in these years. Even the top quintile managed only compound annual growth of only 1% a year in these years, reflecting the disappointing growth rates in real GDP in these years. While technology advocates often label the rise of the Internet an “industrial revolution,” Census data shows clearly that the technological change of the last twenty years failed to deliver broad-based prosperity as, for example, the automotive revolution did in the 1920s and again after World War II.
Figure 2. Real U.S. Household Median Income by Quintile and Top 5%, 1967-2021
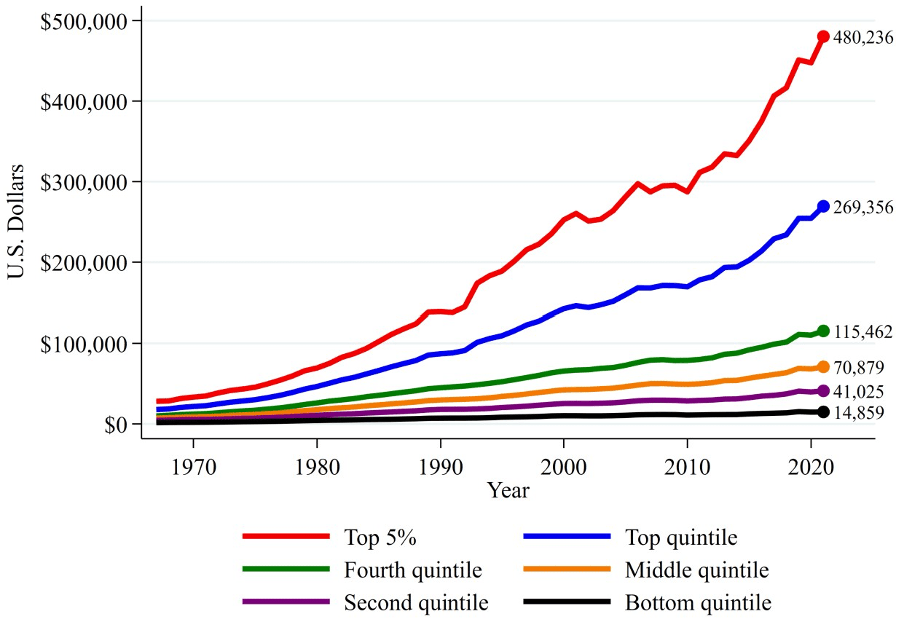
Table 1: Change in Real Median Household Income by Quintile and Top 5%, 2000-2021
| Income Group | Real Median HH Income 2000 (2021 dollars) | Real Median HH Income 2021 (2021 dollars) | Percent Change |
| Bottom quintile | $16,025 | $14,859 | -7.3% |
| Second Quintile | $40,012 | $41,025 | +2.5% |
| Middle Quintile | $66,631 | $70,879 | +6.4% |
| Fourth Quintile | $103,581 | $115,462 | +11.5% |
| Top Quintile | $224,458 | $269,356 | +20.0% |
| Top 5% | $398,211 | $480,236 | +20.6% |
Globalization, Inequality, and Wages
A key driver of the slow growth in incomes and wages is the impact of globalization on the U.S. economy. Globalization has meant increased imports which hollowed out manufacturing industries, depressing output in many manufacturing sectors, and reducing employment and wages. It also meant stagnant or declining real wages for those workers competing directly with industries in low-wage nations.
The effect on wages for lower income groups can be seen clearly in wage data from the Bureau of Labor Statistics. National averages often show incomes rising in recent decades. But if one digs deeper, one sees the forces driving greater inequality. Figure 3 shows hourly wages for all U.S. workers paid on an hourly basis, which totaled 76 million workers, just over half the U.S. employed labor force, last year.
For this group as a whole, the real hourly wage has risen 9.7% from 1979, when this data series begins. A real wage increase of less than 10% in 42 years is a poor result in the context of American history, where economic historians often talk of annual increases of 2% or more, adding up to an increase in the standard of living of 50% to 100% across generations.
But, when one looks at the hourly wage patterns more closely, the story is even worse. Women did much better over these 42 years, with their real median hourly wage rising 26.5% over the period. Women benefited from a move away from traditional secretarial roles, an increase in management roles, and steps towards gender equality in the workplace.
Hourly-paid men, by contrast, actually suffered a decline in their real median hourly wage, of 8.7% over these 42 years. In 2021 dollars, hourly-paid men earned $19.76 an hour in 1979, compared with last year’s $18.05. Moreover, as anybody who has visited a Walmart or a fast-food restaurant knows, hourly-paid workers are not just teenagers in entry-level jobs. Far from it. This group spans the age range from teenage to adulthood to retirement age. These are the men documented in studies by Stanford’s Raj Chetty and others, who will never earn as much as their fathers did.
Figure 3. Female Real Hourly Wages Rise While Male Wages Fall
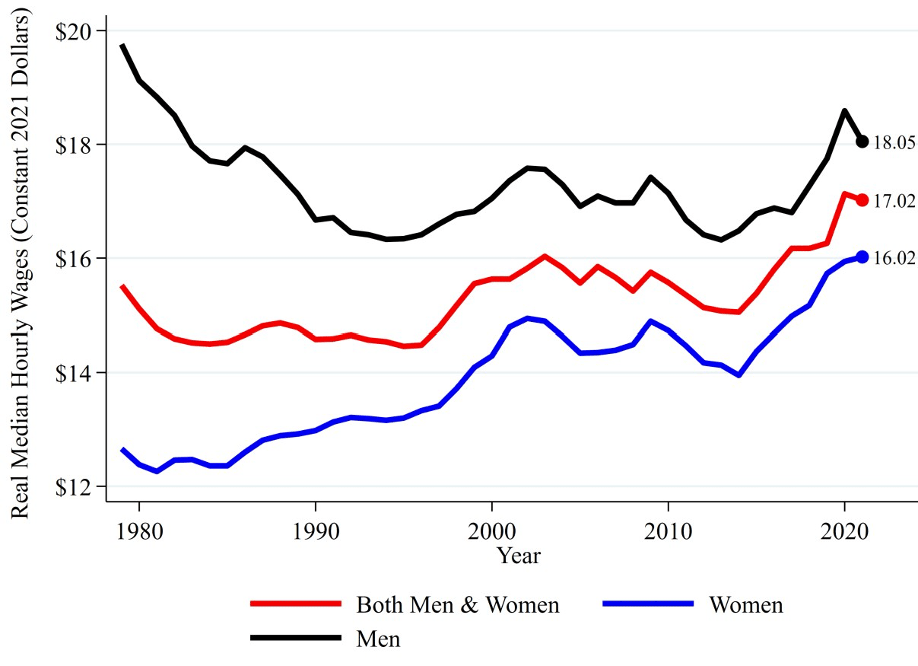
Source: Bureau of Labor Statistics. Series LEU0208183700, LEU0208189000, LEU0208185600.
Trade Liberalization and the Un-Workers
An important study by Nicholas Eberstadt, Men Without Work, published in 2016 and updated earlier this year, pointed out that the number of prime-age men (i.e. men between the ages of 25 and 54) who have withdrawn from the workforce has now surpassed seven million, and is some four times higher than the number of men in that age group counted as unemployed. Eberstadt rightly terms this a “calamity,” that in the richest nation in the world, one in six prime age males are neither working, looking for work, nor in education.
Eberstadt refers to this large group as “un-working” people, since the official definition of unemployed requires that the individual be actively seeking work. The un-working have given up or chosen not to look for work. Using surveys on how Americans spend their time, Eberstadt shows that un-working men are less likely than un-working women to be taking care of family members and less likely to be in education. These men report that they spend hours each day in front of screens, either television or computer screens, where many play video games for hours on end. They are also more likely to succumb to opiates and in extreme cases, “deaths of despair.” Eberstadt labels this the “infantilization” of a growing portion of prime-age American males:
“Work rates for men in 2022 remain at levels not seen since the Depression days of late 1939 and early 1940…these men appear to have relinquished what we think of ordinarily as adult responsibilities not only as breadwinners but as parents, family members, community members, and citizens…they fill their days in the pursuit of more immediate sources of gratification…the data here suggest that something like infantilization besets some un-working men.”[1]
The causes of the growth of the un-working man are likely multiple. They include the decline in real wages for hourly workers, the loss of well-paid manufacturing jobs, the growth in disability programs and other benefit programs, the rise of drug use including opioids, perhaps the rise of the Internet as a form of entertainment, and others. These men survive on a combination of government benefit programs and support from wives, girlfriends, and other family members. The past matters. They may be giving up on working because they are aware that in most cases their fathers and grandfathers were able to find better jobs and live more productive, rewarding lives.
The consequences for our economy, our society, and our ability to sustain the U.S. as a world power are ominous. Politicians and the media focus relentlessly on the unemployment rate (3.5% in September). But with four voluntarily un-working men for each unemployed person, that seems an increasingly obsolete view of our economy.
Eberstadt points out that the trend of the un-working man has been rising steadily since 1965. Neither recessions, labor shortages, nor the pandemic have stopped its steady increase. If one-sixth, and rising, of the prime-age male population who should be contributing to the U.S. economy and society have effectively chosen to withdraw, can we long continue as the leading world power?
Wages in the Automotive Industry
The un-working man problem reflects the situation for those at or near the bottom of the income distribution. Historically, the U.S. automotive industry employed workers who were solidly above the middle of the U.S. income distribution. However, data from the Bureau of Labor Statistics show that the inflation-adjusted hourly earnings of production workers in the automotive industry (about 1 million men and women) have fallen 21% since they peaked in 2003. (See Figure 4.)
This is perhaps the clearest example of the impact of globalization on the American worker. Productivity in auto production has risen relentlessly, as both the automakers and the unions persistently tell us, with robots and other forms of automation dramatically increasing output per worker. Yet wages have trended downward as U.S. workers are obliged to compete with workers in Mexico and China, who earn less than $5 an hour. GM’s decision to shut its Lordstown, Ohio facility, and make the Chevrolet Blazer in Ramos Arizpe, Mexico was an explicit example of how U.S. workers must compete with Mexican workers who have low pay, no meaningful unions and limited safety and other regulatory safeguards.
Figure 4. Real Wages in Auto Manufacturing Have Declined 21% Since 2003
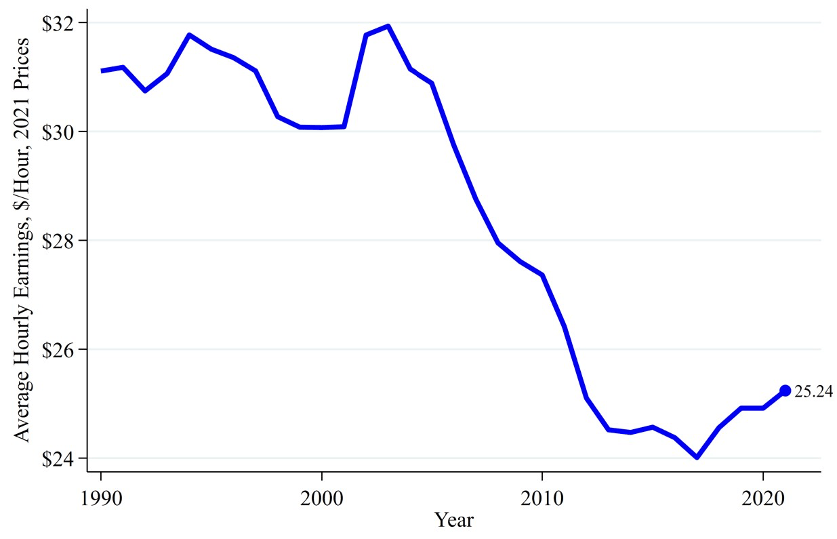
Source: Bureau of Labor Statistics, CPA calculations. Note: includes Motor vehicle assembly, parts, and trailer production segments combined.
Racial Income Inequality Grows Larger
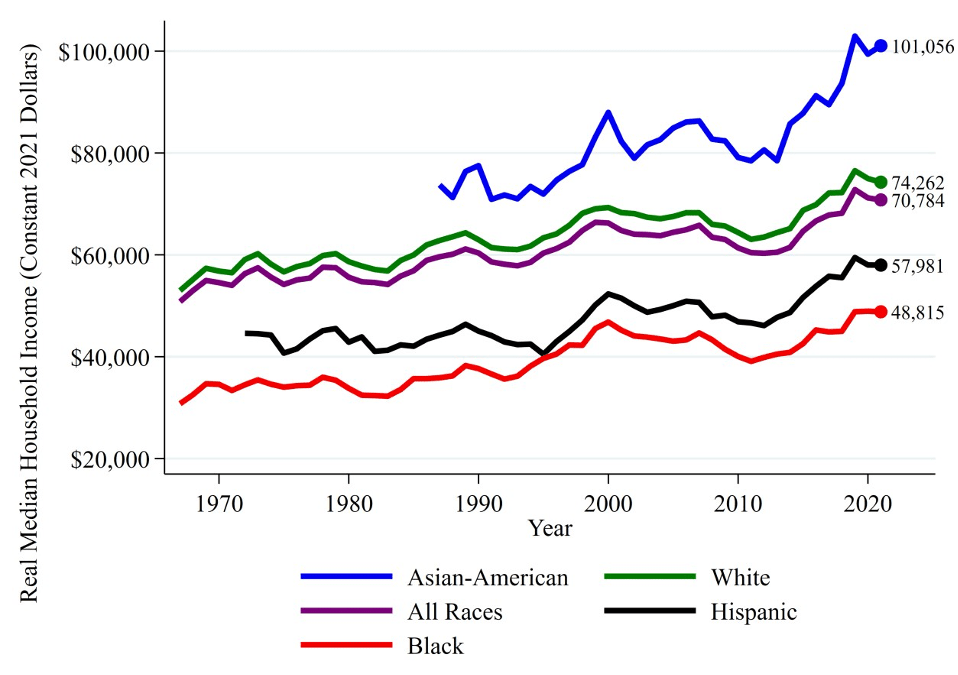
Growing income inequality also has an impact on inequality between races and ethnic groups. Despite many efforts to reduce racial inequality over the last two decades, the divergence between Black and white median incomes has grown. The latest Census data shows that Black household income as a share of White household income has fallen from 68% in 2000 to 66% in 2021. The growing divergence is due to multiple factors, including the fact that Blacks are over-represented in the two groups described above, the un-working and workers in the motor vehicle industry. Hispanic Americans have experienced a similar level of economic disparity with their median incomes rising only 30%, which is notably less than the average income growth across all races (40%).
On the other hand, Asian-Americans have seen their median household income rise from 133% of the U.S. average in 2000 to 143% in 2021. Asian-Americans are over-represented in high-paying industries such as technology.
Figure 5. Growing gap between Black and White Median Income
The International Picture
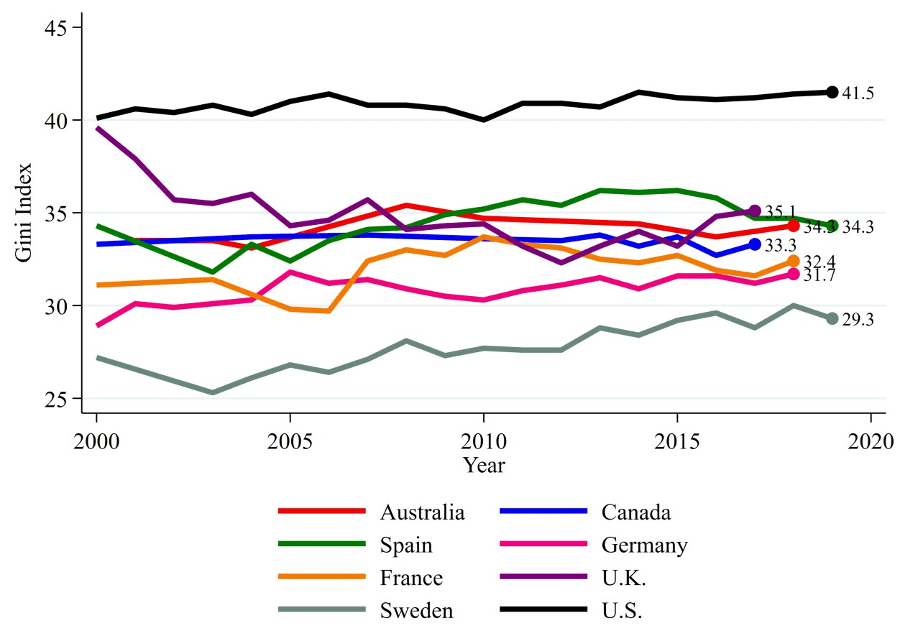
Growing U.S. inequality continues to reinforce America’s role as the most unequal nation among major advanced economies. Economists use a measure called the Gini coefficient to measure inequality. A higher Gini indicates greater inequality. According to the latest available World Bank data, the U.S. stood at 41.5 in 2019, six points ahead of the next most unequal nation, the United Kingdom, as shown in Figure 6.
It is no accident that the two most unequal nations in our graph have smaller manufacturing sectors as a share of GDP than most other large advanced nations. Manufacturing generates more middle-class jobs, especially for those without a college education. The service economy can generate plentiful jobs, but many of those are at the lowest end of the income distribution. They also are more likely to be part-time jobs.
Figure 6: U.S. Most Unequal Advanced Economy as Measured by Gini Coefficient
Conclusion
Growing inequality and stagnant incomes for much of the U.S. population are serious threats to Americans’ well-being at home and our ability to fulfill our traditional international leadership role. America’s rise to preeminence in the 20thcentury was based largely on the productive power of the U.S. economy. Technological leadership, too, tends to follow the growth of production and incomes.
The decline of the middle class, the fall in real male hourly wages, and the rise of the un-working population threaten our ability to maintain our productive potential. Growing divisions between the highly educated and the relatively less educated and between the races threaten our unity and ultimately our democracy.
The Census 2021 Report on Income in the United States, reporting a small decline in median income in what should have been a strong recovery year, only increases this concern.
The best solution for growing inequality is greater economic growth, led by those industries that can employ hundreds of thousands of Americans and provide good jobs for middle and lower income groups. Manufacturing plays the dominant role in such industries. While the Biden administration has taken impressive steps to boost investment in the U.S. electric vehicle and renewable energy industry, more needs to be done.
[1] Eberstadt, Nicholas, Men Without Work, Templeton Press, 2022, pgs. 16, 122.