
Global capital flows are the driving force behind the rise of the dollar, which rose 3.9% in 2021. In the last ten years, the dollar is up 25.5%[1]. The US attracts capital for many reasons, including tax avoidance, speculative trading, and a relatively small amount of genuine investment.
The deregulation of financial markets in the 1970s unleashed a tidal wave of capital onto world markets. While this was promoted and defended by the banking and investment industries as a way to increase efficiency, it has also led to instability, misaligned exchange rates, currency crises in developing countries, large and growing trade deficits and surpluses. The IMF labels all those things “global imbalances,” and tracks it carefully in its annual External Sector report, showing serious global imbalances totaling 1.2% of world GDP in 2020.
These imbalances impact the US by keeping our currency, the US dollar, overvalued, due primarily to the attractiveness of US assets to international investors. The overvalued currency erodes our manufacturing and farm sectors of our economy by giving imports an unfair advantage in the US market and making our exports, including our farm products, less competitive compared to the foreign competition.
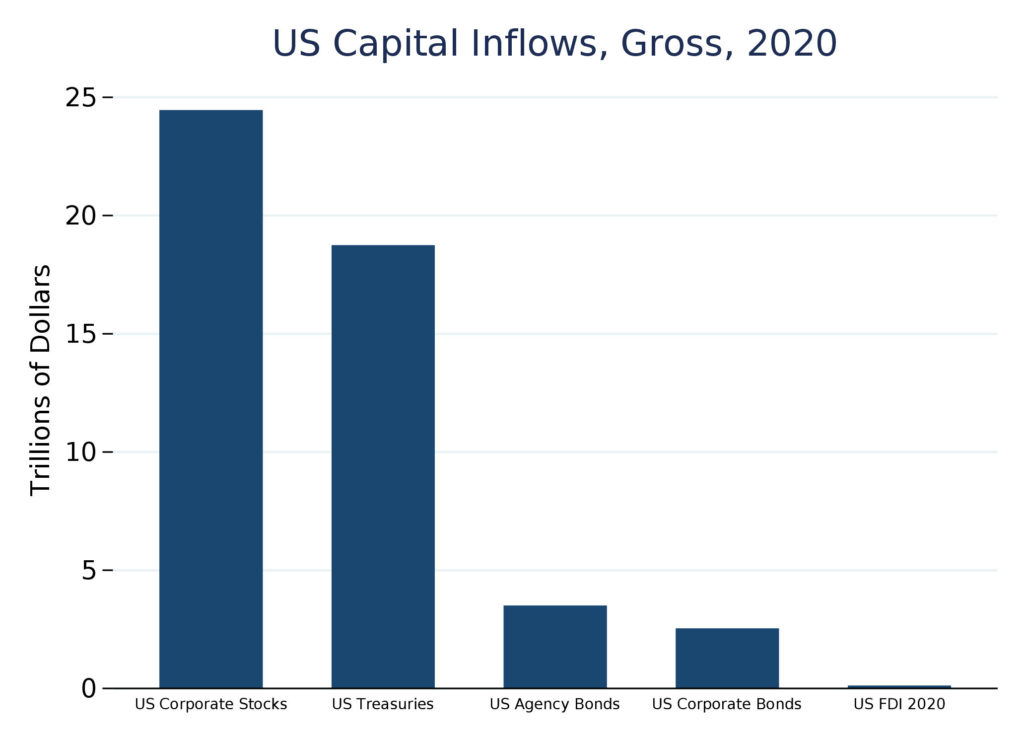
Figure 1: Capital inflows from investment and speculative flows into US stocks and bonds, totaling $49 trillion last year, dwarf foreign direct investment which totaled $120.7 billion. Of that FDI total, only $4.3 billion went to investment into establish- ment or expansion of real industrial facilities. The other $116.3 billion went to acquisitions by foreign acquirors. Source: US Treasury, BEA.
One of the forces driving capital flows into the U.S. is wealthy individuals seeking to avoid taxes. According to the Tax Justice Network (TJN), a London-based nonprofit, the U.S. ranks second in its table of nations offering financial secrecy to global investors. Only the Cayman Islands ranks higher. The TJN cites the U.S. practice of not withholding taxes on interest and dividends paid to foreign investors. Also, the U.S. operates a regime under a law called FATCA that requires U.S. banks to report to the U.S. government on the holdings of U.S. and foreign individuals. But it does not provide such information to foreign governments, which makes the U.S. attractive to wealthy foreigners seeking to avoid taxes in their own countries. The TJN called FATCA a “strong unilateral mechanism that will…do little to dent the US’ role as a global tax haven.”[2]
Early in 2021, the leak of a set of confidential documents from international law firms dubbed the Pandora Papers revealed that the U.S. is attracting billions of dollars of capital from wealthy individuals due to the growth of trusts that under state law provide great secrecy and other benefits. British newspaper the Guardian reported that the Pandora Papers revealed that a Chinese billionaire, Sun Hongbin, transferred $4.5 billion worth of shares in his Chinese real estate firm to his trust in South Dakota. According to the newspaper, beginning in 1983, South Dakota pioneered innovations in trust law to make its trusts more attractive to the global super-rich. According to a South Dakota state government report, trust assets in South Dakota have risen from less than $20 billion in 2000 to $355 billion in 2019. That works out to an annual increase of $17 billion each year, just for South Dakota. It’s unknown how much of these funds represent foreign inflows, but it is likely to be a significant percentage. Further, since the 1980s about twenty other states have copied the South Dakota model for trusts, to try to lure capital from the U.S. and overseas. These innovative trusts are undoubtedly a significant contributor to the foreign capital inflows into the U.S. that put upward pressure on the dollar, weakening the real physical economy of manufacturing and agriculture.
Media reports on capital flows often focus on foreign direct investment (FDI) and link it to job creation in the United States. But the reality of FDI, as documented in annual government press releases, is that the overwhelming majority of FDI into the U.S. consists of purely paper transactions, i.e. a foreign company acquiring a large stake in a U.S. company, with little to no impact on the job market or domestic production. The July 2021 report on FDI into the U.S. in 2020 found that total FDI in 2020 was $120.7 billion, but of that total only $4.4 billion or 3.6% was greenfield investment going towards the establishment or enlargement of a physical plant. All the rest were portfolio transactions. Even in 2015, the peak year for FDI, when total U.S. FDI was $426 billion, the greenfield (physical) investment only amounted to $14 billion or 3.1%.
The biggest driver of FDI into the U.S. is the heated pace of mergers and acquisitions, driven by low global interest rates that makes it cheap for large companies to borrow billions of dollars to acquire other companies. According to a report by financial data firm Refinitiv from October 2021: “Globally, 2021 is the strongest opening nine months of M&A since records began. In the U.S. alone, target M&A has surged 139 percent to US$2 trillion.” Refinitiv went onto say that globally there have been over 40,000 M&A deals in the year to Sept. 30th, and 757 deals worth more than a billion dollars each.
Examples of 2021 international cross-border deals that count as U.S. FDI include the sale by General Electric of its aircraft leasing subsidiary to Irish AerCap for $31 billion, and the sale of railway Kansas City Southern to Canadian Pacific for $32 billion.
The largest single contributor to capital flows in and out of the U.S. is investor purchases and sales of U.S. securities. This is the largest single component of the tidal wave of global savings that sloshes around the world, moving in and out of different types of investments on a daily basis. The U.S. Treasury tracks these investment flows and publishes the data monthly. According to the latest report, for October 2021, in the first ten months of 2021, the U.S. saw a gross inflow of $52.1 trillion, comprising foreign purchases of four types of securities: U.S. Treasury debt, other U.S. government agency debt, U.S. corporate bonds, and U.S. stocks. These inflows have been growing regularly, double the level of the first ten months of 2017. Gross sales by foreigners have also been growing, because the funds are very active in buying and selling securities, but sales are typically slightly below purchases. As a result, the U.S. had a net inflow of foreign capital purchasing U.S. securities of $409 billion in the first ten months of 2021.
The funds for these massive purchases of securities come from global hedge funds, sovereign wealth funds, corporate treasuries, and central banks. The public sector (central banks) has been taking a decreasing share of the total as private savings have mushroomed in recent years. Similarly, stocks are taking a growing share of the total as private investors prefer stocks to the more conservative investment of bonds. The total volume of these funds has been driven upward by the large trade surpluses in countries like China and Germany, by the world’s super-rich investing in hedge funds which are increasingly international in scope, and by growing sovereign wealth funds in oil-rich nations, developing nations, and Asian newly industrialized nations.
All of these sources of investment capital lie behind the strong upward momentum of the U.S. dollar. The irony is that foreign investors put money in the U.S. because they view the U.S. as a strong economy. But those funds drive up the dollar, weakening our manufacturing base and our agricultural producers. According to the U.S. Treasury, U.S. debt to foreigners totaled $22.6 trillion as at June 2021, the world’s largest national external debt. With an annual trade deficit approaching $1 trillion, it’s hard to see the day when we would be able to begin paying back that debt. And meanwhile, the capital keeps flowing in.
[1] Based on the Federal Reserve Board’s Nominal Broad U.S. Dollar Index (DTWEXBGS).
[2] Tax Justice Network, Financial Secrecy Index 2020, Narrative Report on United States of America, pg. 5.