


Summary: This is the first ever estimate of substantial missing import data due to the U.S de minimis program. The “de minimis” provision of U.S. customs law allows imports valued at less than $800 to enter the U.S. duty-free. The impact of de minimis on the U.S. economy is large and getting larger. We estimate the value of de minimis imports into the U.S. at $128 billion last year, suggesting our actual trade deficit in 2021 was 15% higher than official figures show, and U.S GDP was slightly lower. Rising de minimis imports cost the U.S. hundreds of thousands of good-paying jobs and hurt the U.S. manufacturing and bricks-and-mortar retail sectors. Congress should support Rep. Blumenauer’s bill to stop Chinese exporters’ eligibility for de minimis treatment. It should go further and reduce the de minimis limit to $10 to stop the unchecked, unregulated flood of imports into the U.S. market.
Government data on imports and the trade deficit is increasingly understated because the large and growing volume of imports from the de minimis program are not included. The 2021 goods trade deficit is expected to be over $1 trillion, a new high. But our analysis shows there is likely $128 billion of imports missing from the government data. This is a conservative estimate. The actual total could be higher.
U.S. Trade Deficit With and Without De Minimis Imports
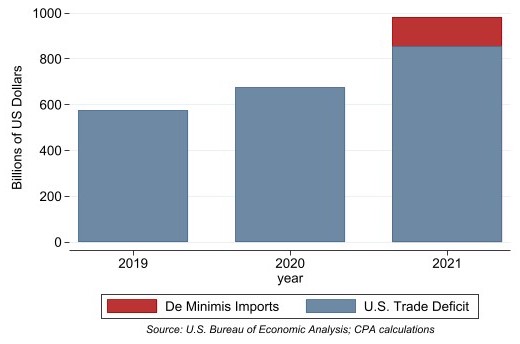
Gray areas represent U.S trade deficit as reported by BEA. (Full-year 2021 trade deficit estimated at $855 billion, pending December due in February.) The red area is CPA estimate of de minimis imports of $128 billion. With de minimis, the full-year 2021 trade deficit would reach $983 billion.
De minimis is a loophole in U.S. law that allows an imported package to enter the U.S. free of tariff, taxes, or inspection if its value is under $800. Since the limit was raised to $800 in 2016, this provision has been increasingly exploited by e-commerce merchants, led by Amazon, to become a huge source of imports into the U.S. It is also a route for counterfeit goods, illegal drugs, and unsafe products to enter the U.S.
America’s de minimis limit of $800 is the highest in the world. The economic costs of de minimis imports include the loss of manufacturing industry, increased intellectual property theft from unregulated importers, and damage to our bricks and mortar retailers, who are forced to compete against importers who pay no taxes at all.
Earlier this month, Congressman Earl Blumenauer, chairman of the trade subcommittee of the influential House Ways and Means Committee, introduced the Import Security and Fairness Act, aimed at stopping the abuse of the de minimis loophole. Blumenauer’s bill would ban shipments from countries that are on both our “Priority Watch List” (meaning they do not seriously enforce IP laws) and our non-market economies list from receiving ‘de minimis’ treatment at our ports. The law is aimed at China, which is overwhelmingly the largest source of imports and counterfeits entering the U.S. under de minimis.
In this article, we develop the first-ever estimate of annual de minimis shipments. Our estimate, of $128 billion, is a very large sum indeed (4.5% of total annual goods imports). As we explain below, that volume of imports costs the U.S. 768,000 high-quality jobs.
CPA has already expressed its support for Rep. Blumenauer’s bill as a means to save jobs, help U.S. industry, and stop evasion by China of existing tariffs. Further, the U.S. should reduce its de minimis limit, which is the highest in the world and grossly out of step with other nations’ limits. China’s de minimis limit, for example is 50 yuan ($7.90), Mexico’s is $50, Canada’s is $200 Canadian dollars ($158), and the European Union’s limit is 150 euros ($170). Europe and Canada have lower de minimis thresholds for their national sales taxes, which prevents the ‘black hole’ open-door chaos we see in our ports. The high U.S. level of de minimis is not only increasing the speed of deindustrialization in America, it is also making it excessively hard for bricks and mortar retailers to survive.
Estimating De Minimis Imports
Last year, the U.S. Customs and Border Protection (CBP) published data showing that in the U.S. fiscal year 2021, 771.5 million de minimis packages entered the U.S. That’s over two million packages a day. According to one estimate, about 1,000 boxes fit into a 20 foot container, so those daily packages require roughly 2,000 container-carrying tractor-trailers to transport them daily.
According to CBP, in October and November of 2021, the first two months of the new U.S. government fiscal year, de minimis packages averaged 66.3 million packages, up a further 3% on the FY2021 level.
CBP provides data on the number of de minimis packages, but there are no estimates of their value, which is a more significant indicator of the impact of de minimis on the U.S. economy. We set out to develop a conservative estimate of the value of de minimis imports, using three methodologies. Our first is based on U.S. Census data on e-commerce sales in the U.S. The second is based on the above-quoted Customs data on packages. The third is based on company reports from major e-commerce merchants.
The U.S. Census surveys U.S. retail businesses every quarter to compile an estimate of U.S. e-commerce sales. The latest survey, for Q3 of 2021 showed that in the first three quarters of last year, U.S. e-commerce sales totaled $651.9 billion, equivalent to 13.3% of total U.S. retail sales of $4.9 trillion. If we annualize the e-commerce figure, we get an estimated $869.2 billion of e-commerce sales in 2021. The CPA Reshoring Index shows that imports accounted for 30.4% of U.S. consumption of manufactured goods in 2020, the most recent annual data available. This figure probably underestimates the share of e-commerce that is imported because import shares are much higher in those sectors that dominate e-commerce retail trade to consumers. For example, the import share in apparel was 89.5% while in computers and electronics import share was 65.3%. These two sectors likely figure heavily in e-commerce sales. (The import share for all manufactured goods is pulled down by food, beverage, and tobacco manufacturing, the largest single sector, where the import share is just 10.0%.)
We would consider the 30% figure a conservative estimate for the import share of total e-commerce sales. That import share yields an estimate of $261 billion for imported e-commerce goods in 2021. It is hard to know how many of those transactions were below the $800 limit. Consumers are incentivized to keep e-commerce transactions below that limit precisely to avoid duties or delays. Anecdotal evidence from various market commentators suggests that the average order on Amazon has a value below $100. Given the powerful incentive both sellers and consumers have to avoid tariffs and delayed shipments, we think a conservative estimate of the share of e-commerce imports below the $800 de minimis limit is 75%. This yields an estimate of $196 billion for de minimis imports in 2021.
Our second method, using CBP data, leads to far lower estimates. The CBP has said that 771.5 million de minimis packages entered the U.S. last year. For example, if we assume each of these packages has a transaction value of $100, that yields total import value of $77.2 billion, less than half of the above estimate from Census retail data. It is entirely possible that the average value of a single imported e-commerce transaction is well below $100. On the other hand, it is also very possible that the CBP method of counting packages is an underestimate. It’s unlikely that CBP has the manpower to actually count 771 million packages, so the figure could be an estimate.
For our third estimate of e-commerce imports, we looked at the company filings of leading merchants. Company data can be more accurate than government data because public companies (and many private companies) are required by law to file accurate reports and are legally liable for publishing misleading information. Public company filings are routinely reviewed by legal staff to confirm accuracy before publication or transmission to the Securities and Exchange Commission.
Amazon is the 800-ton gorilla of online shopping. Amazon’s earnings report for Q3 2021 showed North American retail revenue of $197.5 billion for the first three quarters of 2021. If we prorate that to include a fourth quarter at the same rate, we get full-year revenue of $263 billion. If we assume that 90% of that revenue is in the U.S. (Canada and Mexico’s combined GDP is less than 10% of the North American total), we get an estimated $237 billion of U.S. revenue for 2021.
It is difficult to estimate the share of Amazon’s U.S. revenue taken by imports. Undoubtedly, many Amazon sellers are based in the U.S., and some percentage are selling products made in the U.S. But foreign vendors, especially in China, occupy a large and growing role on the Amazon platform, through both third-party sellers and Amazon’s own brand merchandise. MarketplacePulse, a consulting service for Amazon sellers, does the best job of evaluating the Amazon market, based largely on counting the number of sellers and new sellers joining the Amazon website. Last year, Marketplace Pulse estimated that 63% of new sellers that joined Amazon were China-based, and that 30%-40% of Amazon’s U.S. sales were from China-based sellers. We think that 30% is a conservative estimate of imports as a share of total Amazon U.S. revenue.
In Table 1, we present some back-of-the-envelope estimates of import revenue for major U.S. e-commerce websites. We include just five large online commerce websites that have disclosed their U.S. online revenue totals. The total of these sites alone is $375 billion. If we assume that 30% of this revenue is imports below the de minimis threshold, that yields $112.4 billion of de minimis imports. These merchants are a majority of the U.S. online market but far from a comprehensive total. Other merchants, such as Target or Home Depot, are also doing billion-dollar online business but do not break out their online revenue on a quarterly basis. However, to remain conservative, we will use the $112 billion figure as an estimate for total U.S. de minimis imports in 2021.
Table 1. Online U.S. revenue of leading Internet retailers
| Retailer | Total U.S.. Online Revenue Q1-3 2021 | Annualized U.S. Online Revenue | Import Share of Online Revenue |
| Amazon | $ 197.5 | $ 263.3 | $ 79.0 |
| Walmart | $ 33.6 | $ 44.8 | $ 13.4 |
| EBAY(*) | $ 29.3 | $ 39.1 | $ 11.7 |
| Wayfair | $ 10.5 | $ 14.0 | $ 4.2 |
| Best Buy | $ 10.2 | $ 13.6 | $ 4.1 |
| Totals | $ 281.1 | $ 374.8 | $ 112.4 |
| All figures in Billions of Dollars | |||
| Note: EBAY figure is Gross Merchandise Value | |||
| Source: Company reports, CPA calculations | |||
Our three rough calculations of U.S. de minimis imports in 2021 average out to $128 billion (see Table 2). Although this is a very large sum, it is likely conservative. It does not include the hundreds of smaller U.S.-based e-commerce merchants. It also does not include large Chinese-headquartered e-commerce platforms with multibillion dollar businesses selling to U.S. consumers, such as Alibaba and Shein.
Table 2. Three Estimates of De Minimis Revenue
| Methodology | Data Source | De Minimis Revenue Estimate (2021, $ Billions) |
| Retail Sales Survey | U.S. Census | $196B |
| De Minimis Package Count | U.S. Customs & Border Protection | $77B |
| Company Reports | SEC filings | $112B |
| Average | $128B | |
| Source: CPA estimates from above sources | ||
De Minimis Impact on U.S. Trade Data
We asked the U.S. Census how they dealt with de minimis imports in their accounts of U.S. good imports. A Census official told us: “Shipments that meet the de minimis criteria do not require filing and therefore we never see them. As a result, they are not included in our low-value estimation process since we receive no data on which to base an estimate.” (The low-value imports estimation process refers to imports which are above the de minimis threshold but which go through Customs with less information than most imports.)
The federal government has reported monthly trade figures through November 2021. Based on that data, and making a quick assumption that December figures will be in line with previous months, total goods imports last year will reach a record $2.83 trillion. The overall trade deficit, including goods and services, will likely rise from the 11-month total of $785 billion to reach $855 billion for the year (an all-time record annual trade deficit for the U.S. and for any nation in world history).
However, neither of those figures includes de minimis imports. The addition of our estimate for de minimis would increase total goods imports by 4.5% and increase the trade deficit by 15%. Further, a rise in imports of $128 billion would likely reduce the level of U.S. gross domestic product (GDP) as imports are a subtraction from GDP.
Absent Government Action, De Minimis Imports Will Continue to Grow
Import revenue, and sub-$800 import revenue, is likely to continue growing as a share of total U.S. online spending, which is itself growing as a share of total retail spending. Amazon has led the way in recruiting Chinese sellers to its site, holding meetings in Chinese cities since at least 2016 to encourage and educate Chinese entrepreneurs on how to sell to U.S. consumers.
Walmart now appears to be following in Amazon’s footsteps, recruiting thousands more international sellers to its site. Walmart recently announced a change in chief executive for its online business, likely because it wants to see faster growth in online revenue. According to MarketplacePulse, Walmart has even accepted some of the Chinese sellers that Amazon removed for publishing thousands of fake reviews. Last year, a senior Walmart executive told a conference in Shenzhen: “Chinese sellers have very obvious advantages in the global cross-border e-commerce field.”
That’s an understatement. Those advantages include the ability to sell counterfeit products, fabricate fake reviews, make spurious claims for their products, all while being for all practical purposes immune from any consequences under U.S. law or regulations.
This huge volume of de minimis imports impacts the U.S. in several ways. First, with the overwhelming majority of those imports coming from China, it represents lost tariff revenue which could be in the range of $20 billion. Secondly, it represents a huge loophole in the enforcement of the Section 301 tariffs on China. Thirdly, if we use the well-known rule of thumb that every billion dollars of imports represents 6,000 lost jobs, then this figure accounts for some 768,000 jobs lost in the U.S. to imports. With the Federal Reserve committed to hold down unemployment, instead of rising unemployment, the U.S. suffers the impact of rising imports in the growth of low-paid, low-quality service sector jobs. This exacerbates income inequality, job dissatisfaction, as well as racial and generational disparities.
More Data on De Minimis Urgently Needed
We would urge Rep. Blumenauer to lead an effort to develop official government data on the size, source, and product categories of annual de minimis imports. He should do this in two ways: he should ask U.S. Census and Customs and Border Protection to work together to develop official data on the monthly volume and value of de minimis shipments. But because counting hundreds of millions of packages is a difficult and expensive task, he can also take a shortcut. He can hold hearings with senior executives of leading e-commerce firms, including of course Amazon. He should ask them to disclose the value of the de minimis shipments they bring into the U.S. each year. Most e-commerce firms will already have this data in their computerized transaction records. They can reveal this data to Congress and the public without violating their competitive positioning or their obligations to investors.
More data, and accurate data, on de minimis is urgently needed.


