By Marc Fasteau & Ian Fletcher
Marc Fasteau and Ian Fletcher are authors of Industrial Policy for the United States: Winning the Competition for Good Jobs and High-Value Industries (Cambridge University Press 2024), a widely praised book on industrial policies in US and world history and the need for US industrial policies today.
A popular argument has emerged (examples of which you can read here, here, here, here, and here) that America’s economy is so large and doing so well that we don’t need to change course — that our wealth and growth rates prove we’ve already found the right formula. On the surface, America looks like an unrivaled success story. Yet beneath the headline numbers lies an economy increasingly dependent on foreign production, hollowed out in critical industries, and unable to provide secure, high-wage work for many of its citizens.
This argument is a major obstacle to the US adopting the kind of comprehensive industrial policy that it actually needs, the kind we sketched out in our book Industrial Policy for the United States: Winning the Competition for Good Jobs and High Value Industries. So it’s worth analyzing why it isn’t true – if the relevant statistics are interpreted correctly.
The problem isn’t that America lacks prosperity — it’s that our prosperity has become detached from production. A truly strong economy doesn’t just measure how much we consume or how high our GDP ranks; it measures how much we make, how much we innovate, and how much value we create at home. When the foundation of our productive capacity erodes, so does our ability to sustain growth, defend our nation, and deliver opportunity to our people.
That’s why we need a national industrial strategy — one that values the strategic importance of industries located on U.S. soil. The following data and trends, properly understood, show not that America is “too successful to need reform,” but that our current success is masking deep structural weaknesses that only a coherent industrial strategy can fix.
Let’s start with the common claim that America surpasses all other significant countries – indeed, apart from a few accounting anomalies, microstates, oil states, and city states, all other countries simpliciter – in GDP per capita. We’re just richer than anyone else.
On the surface, this does appear to be true, as shown in the table below (source):
FIGURE 1: GDP PER CAPITA
# 1 | Monaco | $ 256,581 |
# 2 | Liechtenstein | $186,400 |
# 3 | Luxembourg | $128,678 |
# 4 | Bermuda | $125,842 |
# 5 | Ireland | $103,888 |
# 6 | Switzerland | $99,565 |
# 7 | Cayman Islands | $97,750 |
# 8 | Isle of Man | $94,300 |
# 9 | Norway | $87,925 |
# 10 | Singapore | $84,734 |
#11 | United States | $82,767 |
We really do seem to be a standout economy: The largest country richer than us, Switzerland, has fewer people than Greater Chicago. And our closest rival, Australia, has roughly one tenth our population and is 22 percent behind us in per-capita GDP.
Here’s how this all looks on a chart (source):
FIGURE 2: GDP PER CAPITA
It certainly looks like impressions of utter American superiority are justified. But now let’s start correcting for statistical distortions.
For a start, the above data is all nominal figures. This means taking the economic output of a country, which is mostly denominated in its own currency, and converting it to dollars at market exchange rates so different countries can be compared. The problem is that the same economic output costs more in developed nations – the price of a cup of coffee, for example, reflects the wages of the coffee shop – so all developed nations, including the US, appear to be richer than they really are simply because the same amount of output is more expensive there.
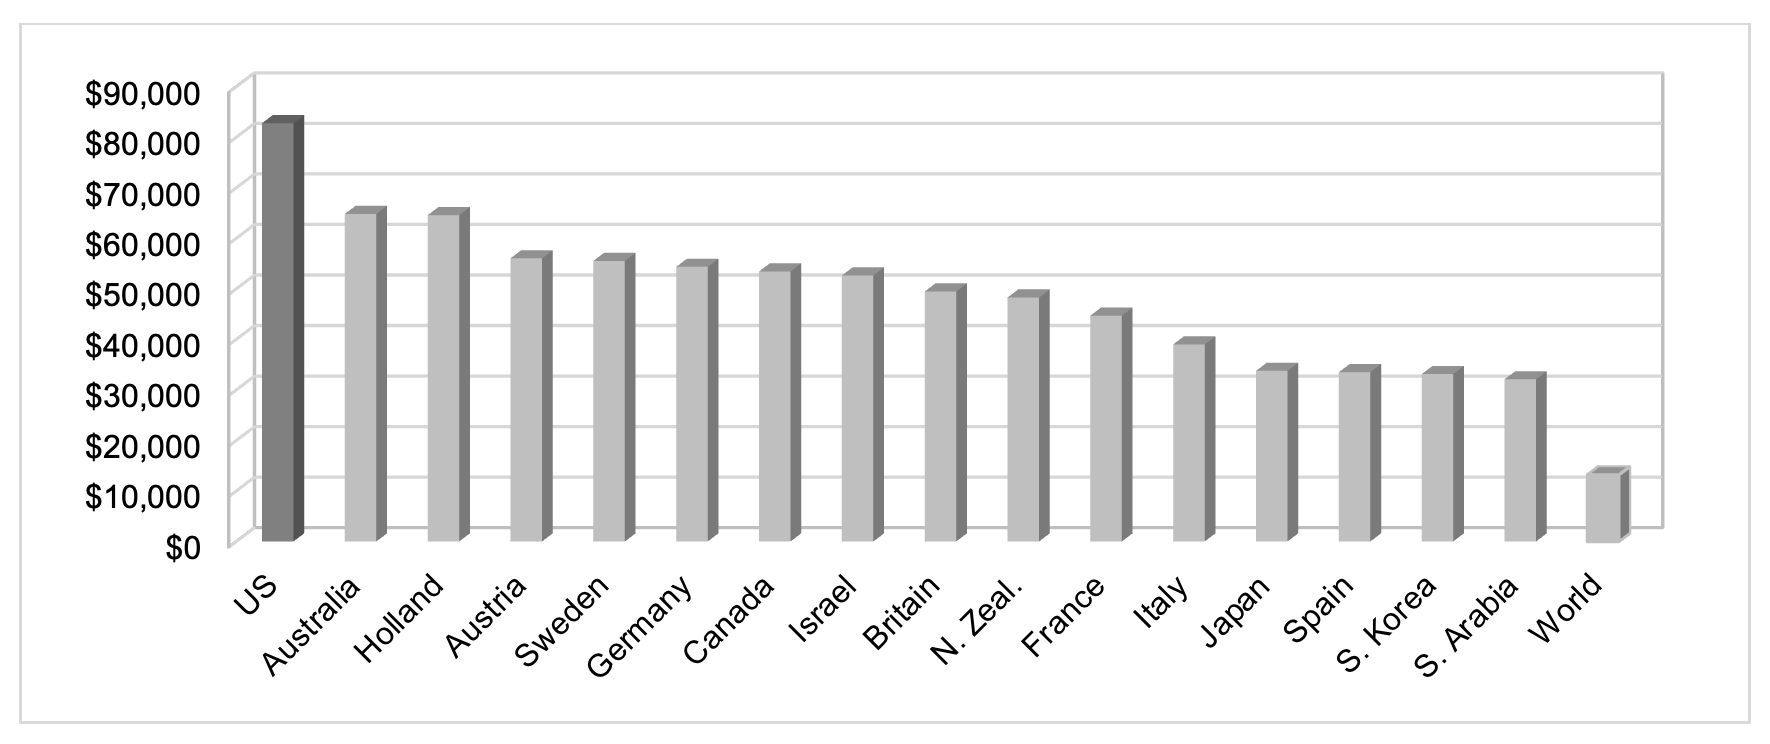
Adjusting for these differences in prices between nations uses a well-established technique known as purchasing-power parity (PPP). On a PPP basis, US per-capita GDP is only 3.9, not 6.3, times the global average. The US also has a smaller advantage over the other leading economies because its economy is more distorted by higher prices. Here’s how a similar chart looks using PPP numbers:
FIGURE 3: GDP PER CAPITA AT PURCHASING POWER PARITY (PPP)
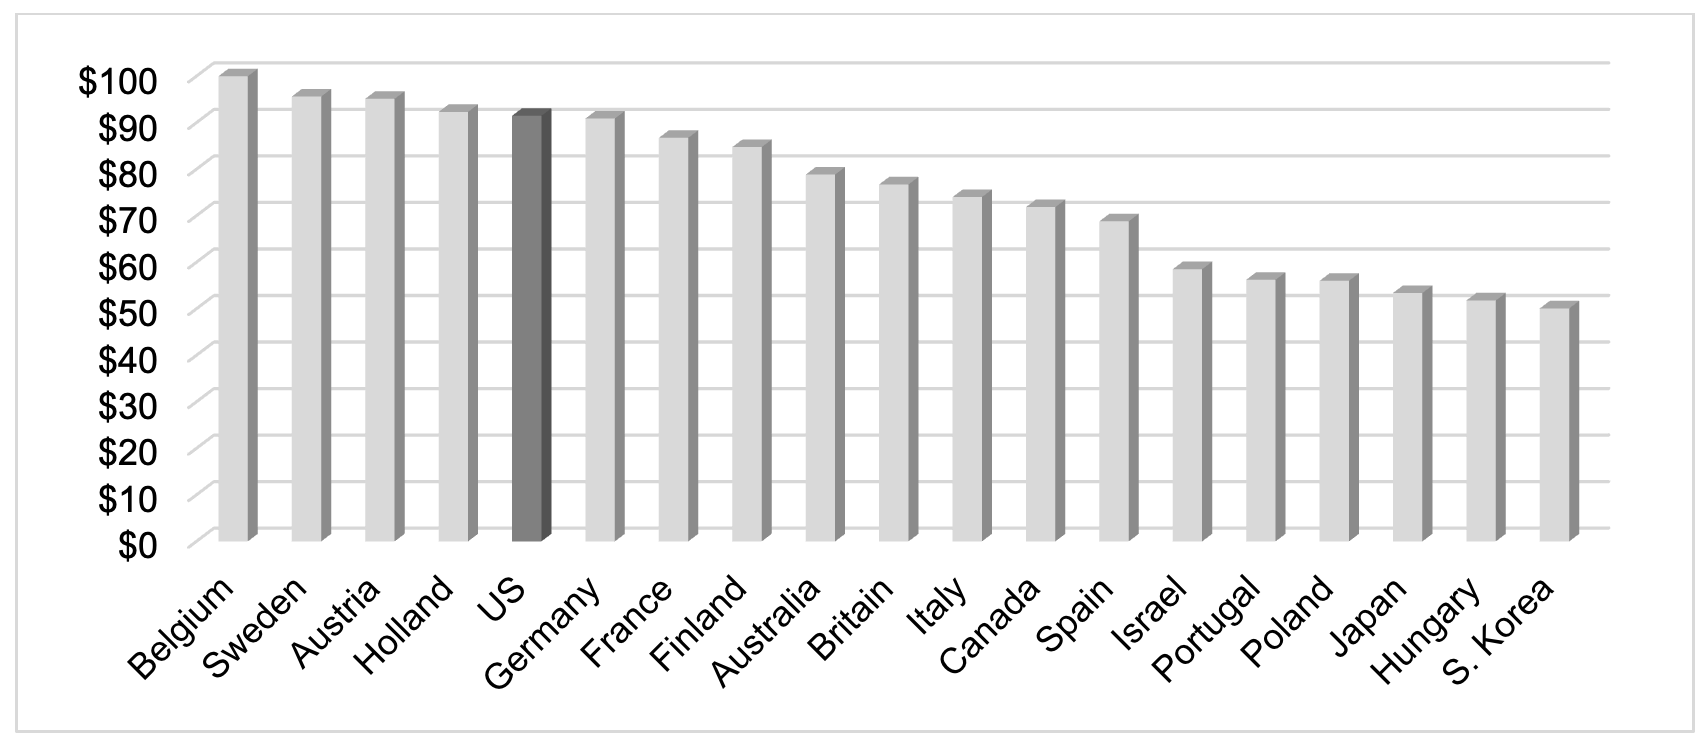
Next, we need to adjust for the fact that the U.S. has longer work hours than most other developed nations. As a result, our PPP per-capita GDP per hour worked is actually lower than than Belgium, Sweden, Austria, and Holland, barely above Germany, and not much above France and Finland. Here’s the chart (source):
FIGURE 4: PPP GDP PER CAPITA HOUR WORKED
Of course, longer hours can hypothetically be either good or bad. One can argue that they reflect a strong work ethic. Or, conversely, workers being squeezed by heartless management. One can argue that that they’re bad for family values. Or that they’re just a personal choice. Or that they should be. But higher output caused merely by higher inputs, such as work time, does not constitute economic superiority. We’re not better bakers: we just bake more bread because we use more dough.
Another way to put it is that America isn’t as rich as it looks because while it’s strong in producing priced goods – things sold in the marketplace for money – it underproduces unpriced goods like leisure time. It’s easy to mock unpriced goods, but the fact that you personally would almost certainly pay hard cash for more free time if the price was right confirms that it is indeed something of real economic value. So, contrary to what some people will tell you, this is not a noneconomic (and therefore supposedly irrelevant) criticism of economic facts.
Finally, consider income inequality. Because whatever your political interpretation, i.e. whether you think inequality is deserved or that government should to try to reduce it, the US has greater income inequality than most other developed nations.
One measure of this is that only 53% of total American income goes to the bottom 90% of the population, which is less than over a dozen other developed nations. As a result, US per capita income for the bottom 90% of the US population is less than in Holland and is not much above several other countries. Here’s the chart:
FIGURE 5: PER CAPITA INCOME FOR BOTTOM 90% OF POPULATION
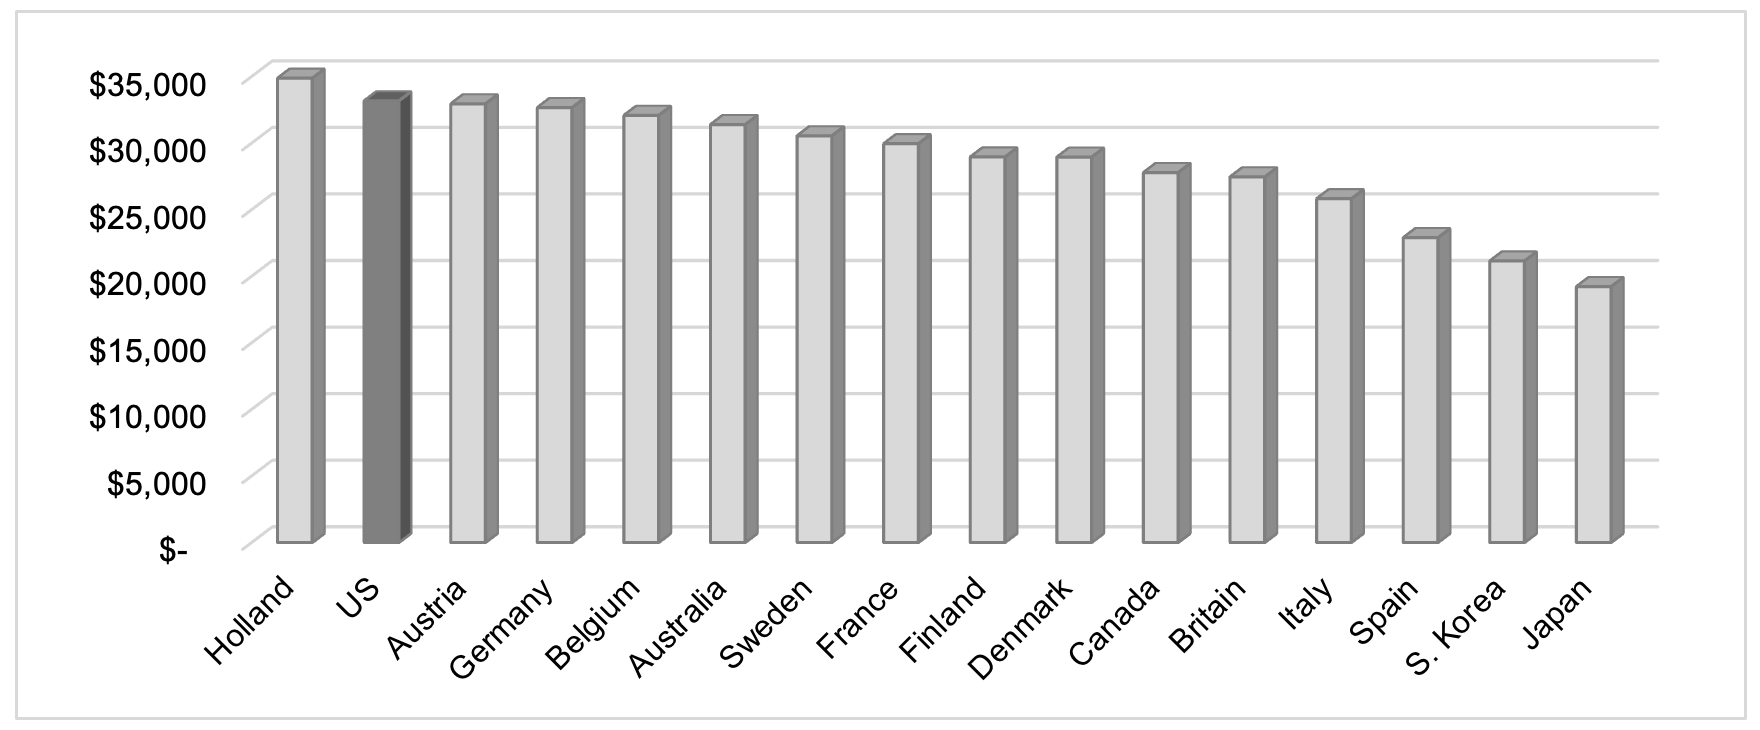
It follows that America’s margin of economic superiority, for practical purposes for most Americans, is just not that large if it exists at all.
Don’t misunderstand here. The US is not secretly a poor country. We are indeed among the world’s richest economies. But we are not in a league of our own with performance so superior as to justify either a) policy complacency or b) disinterest in the economic policies of other nations some of whose policies are better than ours.
Other apparent indicators of America strength, such as our unemployment rate, should also be peeled back a bit. The rate (4.3% as of September 2025) usually quoted is a Bureau of Labor Statistics construct technically known as “U-3.” It is defined as the percentage of the civilian labor force that is unemployed and actively seeking work.
But this number deliberately ignores the following people:
a) “Discouraged workers,” i.e., those who have stopped looking for work because they don’t expect to find any
b) “Marginally attached workers,” i.e., those who are available to work and have looked in the past year, but are not currently looking
c) People who want to work full-time but can only find part-time work.
The statistic that includes all of the above is known as U-6, and it stands right now at 7.9%. And if one expands this metric to include also people who make only a poverty-line wage or less, the number is 24.1%.
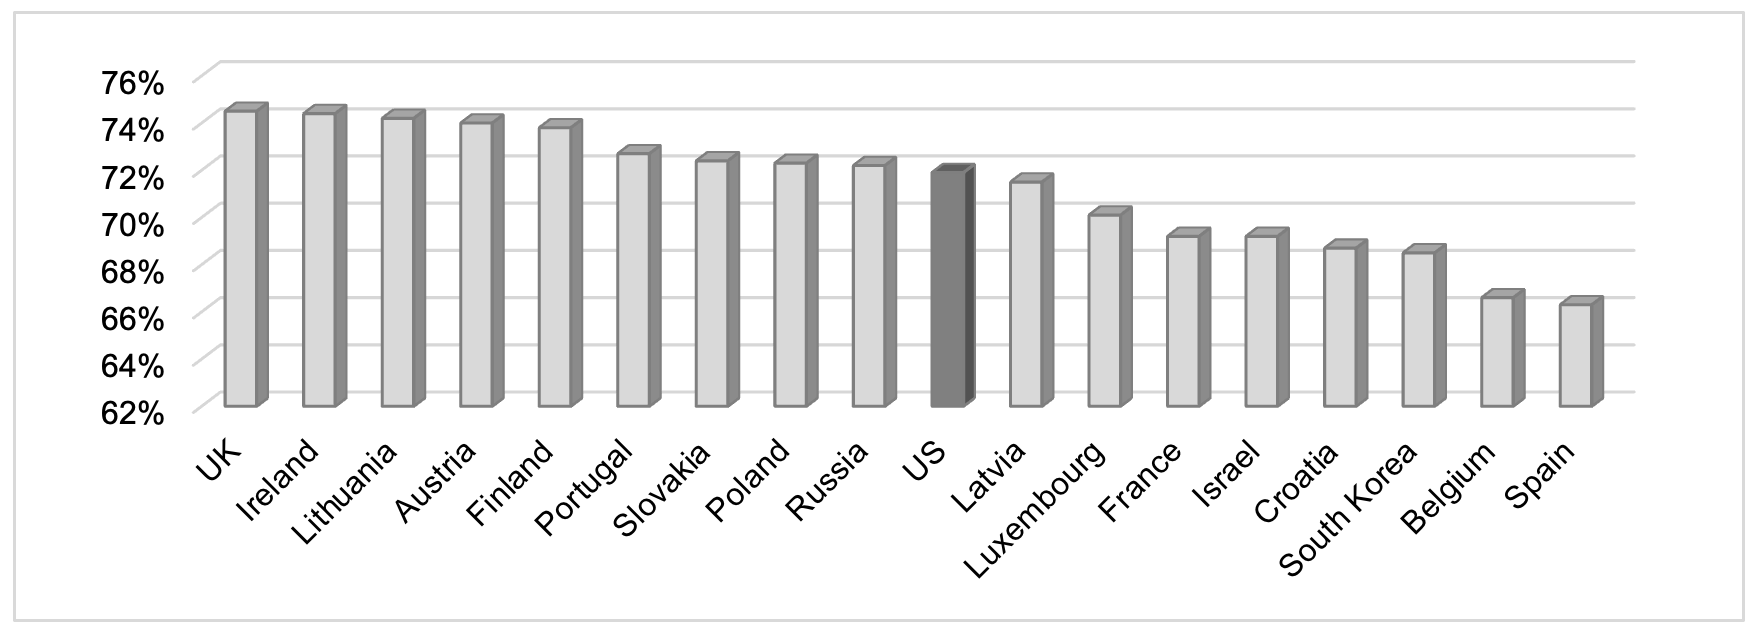
A better statistic than the unemployment rate is the employment rate, also known as the employment-to-population ratio. This measures a society’s success in getting people productively employed. As you can see below, US performance by this metric is nothing special (source):
FIGURE 6: EMPLOYMENT-TO-POPULATION RATIO
Another misleading statistic? Quite a few people people have argued in recent years that American manufacturing is doing just fine because total US manufacturing output is supposedly at an all-time high. Examples may be found here, here, here, here, here, here, and here.
For a start, this is actually an absurd statistic by which to measure the health of America’s manufacturing sector. U.S. output levels of everything from peanut butter to Disneyland visits are at all-time highs simply because the country’s population is at an all-time high. So even if this figure were true, it would prove absolutely nothing about good or bad economic performance.
Furthermore, the “manufacturing is at an all time high” statistic is misleading because this only holds true if one includes semiconductors and other IT products, which are a small fraction of the economy and a small fraction of the manufactured goods we consume. Take these industries out of the picture and U.S. manufacturing output has been stagnant since 2000. That’s a full 25 years without manufacturing growth – the first time this has happened since the country was founded.
Even worse, there are good reasons to doubt that the reported output growth in IT is even real. As economist Susan Houseman has noted,
The extraordinary output and productivity growth in computers and semiconductors reflects the way statistical agencies account for improvements in the products produced in this industry.
This last sentence refers to the fact that, as has been analyzed by Fed economists, standard statistics mistakenly count cost savings from offshoring as increases in domestic productivity. So we have been imagining that our own industries have been gaining in productivity when they have merely been benefiting from productivity gains abroad! These foreign gains do benefit the US under some circumstances, but they are not the same thing as higher productivity at home.
A better statistic for assessing the health of America’s manufacturing sector would be the percentage of our consumption of manufactured goods that is satisfied by domestic production. As of 2025, that figure was down to 63%, a full 13 points less than 2004.
This decline might have been acceptable if America was paying for all these imports with expanding exports of services, as some people appear to think we have done. But while service exports have indeed gone up, but they haven’t gone up nearly enough to cover the difference. We are instead running huge trade deficits that we pay for by selling off existing assets and going into debt to foreign nations.
Some Pollyannish statements about America’s economy don’t have even the excuse of misleading statistics as their origin, merely popular intuitions that don’t survive contact with hard data. For example, a surprising number of commentators appear to believe that the U.S. is doing just fine in manufacturing because it is still succeeding in advanced manufacturing and has only sacrificed primitive sectors. (You can find people saying this here, here, here, here, here, here, and here.)
In reality, this is an argument whose last plausible connection to fact was around Y2K. Since then, American high-tech manufacturing has been in clearly documented decline. The most obvious indicator of this is our huge and rising trade deficit in the official statistical category “advanced technology products” – $297 billion in 2024.
If the US were strong in these industries, we would be exporting these products on net, not importing them. That it matters what industries, or more precisely economic activities, a nation has is the root premise of industrial policy. So, this deficit is the kind of problem industrial policy exists to solve, and indeed a problem that is basically impossible to solve any other way. This is why the US needs proactive industrial policies, not just old standbys like a good business environment, moderate tax rates, reasonable regulations, etc., to succeed.
Let’s zoom in on the decline of America’s tech industries – masked by today’s spectacular successes in some fields like artificial intelligence – for a minute. Consider the condition of three major high-tech sectors in the late 1980s versus today:
- Pharmaceuticals and medical devices
- Aerospace
- Computers and electronics
These industries’ combined portion of GDP has declined from 4.8% to 2.6%, and their share of employment has fallen from 2.8% to 1.3%. This is a clear sign of a nation that is retreating from advanced sectors, not growing them. Other nations, above all but not only China, have been expanding here thanks to their proactive industrial policies. At a minimum, we need defensive industrial policies, such as tariffs, to protect the industry positions we already have.
America’s global market share, a good indicator of our competitiveness, has been falling in one high-tech sector after another. For example, since the mid-1990s the U.S. has fallen from 37% of world semiconductor production to 12%. This was, of course, a major reason the CHIPS Act was passed under Biden and reluctantly kept alive under Trump.
This problem extends beyond high tech to many of the mid-tech industries that are the backbone of developed economies. For example, according to a recent McKinsey study, from 1995 to 2020 the US lost the following amounts of global market share:
- 11 percentage points in “learning curve” manufacturing industries such as precision tools, semiconductors, and communications hardware.
- Six points in scale-based and standardized sectors such as basic metals, automobiles, fabricated metals, petrochemicals, and specialty chemicals.
- Four points in flexible and customizable sectors such as special-purpose machinery, marine and railroad equipment, aircraft, and military hardware.
These industry-level indicators of decline are arguably more important than the GDP figures we discussed earlier, because success in industries is the basis for a nation having a high per-capita GDP, not the other way around. The only way to be a high-income nation is to have people working in jobs with a high value-added per man-hour, and only certain industries can achieve this. This is why most Americans instinctively grasp that it’s not a winning move for our people to be flipping hamburgers rather than assembling cars.
Another reason to avoid complacency is that current per-capita GDP is a trailing indicator of the underlying soundness of a nation’s economy. Nations on the way up establish industry-specific competitiveness first, then grow rich on the strength of it, while nations on the way down have considerable economic “momentum” that can mask their underlying problems.
The lesson of history is clear: economic statistics often lag reality. In the 1959 election, the British Conservative Party ‘s unofficial slogan was “You’ve never had it so good.” With Britain’s economy growing 4.1% that year and 6.3% the next, this was true at the time, but their industrial base was already eroding. Within a generation, the country’s manufacturing power, global influence, and middle class had all declined.
America now faces a similar crossroads.
We remain a wealthy nation, but that wealth rests increasingly on fragile foundations. Our share of global industrial production is shrinking, our high-tech sectors are losing ground, and our prosperity is built on borrowing and consumption rather than on making and building. These are not signs of enduring success — they are warning lights.
A national industrial strategy is not nostalgia for the past. It is the only way to ensure that America’s economic strength, innovation, and security endure into the future. By rebuilding domestic production, restoring advanced industries, and investing in the skills and technologies that drive value creation, we can turn today’s temporary advantage into lasting prosperity. Without such a strategy, our apparent success will prove as fleeting as Britain’s — but with one, America can again become the world’s most dynamic industrial power.