
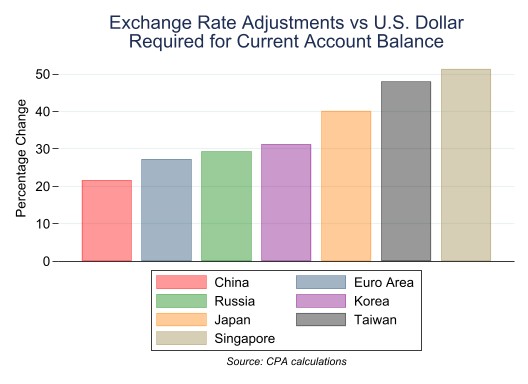
A new CPA study, using widely accepted methodology and IMF data, shows that for the world’s major economies to achieve fair currency values and eliminate global imbalances, large adjustments in major currencies would be required. The dollar would need to fall by 16.6%, while the Chinese yuan would need to rise against the dollar by 21.7%, the Japanese yen by 40.2%, the Euro by 27.3%, and the Korean won by 31.3% (see Figure 1). The persistent misalignment of the dollar has made the US economy less globally competitive and worsened income inequality. Current policy efforts aimed at rebuilding supply chains, while worthwhile, face substantial headwinds if dollar overvaluation is not addressed.
Figure 1. Currency changes required to achieve global current account balance.
The new study is based on methodology developed by economists John Williamson and William Cline of the Peterson Institute for International Economics (PIIE). Global imbalances are caused by nations running large surpluses or large deficits in the current account of their balance of payments. The best way to reduce or eliminate global imbalances is to realign national currencies to move nations’ current account balances closer to zero. Williamson and Cline developed a methodology to estimate globally consistent currency adjustments needed to simultaneously bring all major nations’ current account balances closer to zero.
Methodology
The Cline-Williamson methodology looks at the current levels of current account balance and GDP of 34 major nations and IMF forecasts of each economy five years out. As currencies rise, surplus countries’ current account surpluses will shrink, while for deficit countries, a lower or more competitive currency reduces the current account deficit. The Cline-Williamson solution allows currencies to fluctuate to bring current accounts to within plus or minus 3% of national GDP. (See Cline, 2017). Cline and Williamson put this flexibility into their solution to allow for cross-border investment flows, which were traditionally from rich countries to poor countries as rich country investors sought new investment opportunities.
CPA has modified the methodology to target bringing all 34 currencies as close to full current account balance as possible. In our view persistent deficits, even when small, degrade an economy’s performance through deindustrialization. The degradation gets worse as the deficit persists. A target of zero for all current account balances is a valuable policy goal to halt and then reverse deficit national economic degradation. Complete balance would also require surplus countries to rebalance their economies to rely more heavily on internal, rather than external consumption, i.e. exports.
Nations that run persistent surpluses, such as China and Japan, build up their production at the expense of deficit countries. In effect, they export unemployment to the deficit countries. Persistent deficit countries suffer underemployment, deindustrialization, loss of essential industries, and greater income, racial, and generational inequalities. In deficit countries like the U.S., measures taken to stimulate domestic economic growth without addressing the current account deficit tend to lead to disproportionate expansion of low-wage service sectors and an increase in the value of financial assets held mainly by upper income groups.
From a global perspective, misaligned currencies create risks to the world economy. In the words of the International Monetary Fund (IMF) External Sector Report, “Excessive current account imbalances can fuel trade tensions, become targets for protectionist measures, and increase the likelihood of disruptive asset price adjustments.” (IMF 2021a, pg. ix) The IMF estimated the level of global imbalances in 2020 at $1 trillion, or 1.2% of global gross domestic product (GDP).
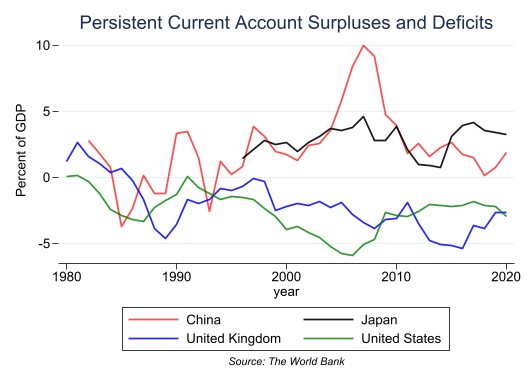
Figure 2 shows the persistence of four major nations’ current account balances as a share of their GDP from 1980 to 2020. The U.S. has been in deficit for 29 consecutive years. China has been in surplus for every year since 1994, or 27 consecutive years. Japan has been in surplus for the 25 years for which the World Bank publishes data. The U.K. takes the prize for most persistent large-nation deficit with 35 years of consecutive deficit. Over this period, the U.S. and U.K. have suffered protracted deindustrialization and increasing income inequality as low wage/low hour service jobs increasingly predominated.
China and Japan have taken advantage of undervaluation as they built up their manufacturing sectors, producing more than they consume and exporting the excess primarily to deficit countries. The result was growth in worker incomes in their manufacturing sectors. At one point, China’s surplus reached 9.9% of its GDP, unprecedented for a large nation. The U.S. deficit is largely a mirror image of the Chinese surplus, reflecting the large bilateral trade imbalance in which China exports hundreds of billions of dollars of manufactured goods to the U.S. each year while buying far less U.S. goods.
Figure 2. Major nation current account balances show persistence of deficits (US, UK) and surpluses (China, Japan).
Results of the Analysis
Table 1 shows the results of the CPA analysis. The first column shows each nation’s exchange rate in dollar terms as of last October, the date of publication of the IMF’s most recent World Economic Outlook (IMF 2021b). The next column shows the adjustment required in that rate to produce balanced current accounts in 2026, calculated by the Cline-Williamson model and based on the IMF’s forecasts for the world economy in 2026. A positive percentage change means the currency must rise in terms of dollars (revaluation) and a negative percentage change means the currency must fall (devaluation) in dollar terms. The final column shows the fundamental equilibrium exchange rate (FEER) in terms of dollars necessary to bring the global system as close as possible to complete balance.
A quick summary would be that East Asia is a surplus area and most of its currencies need to rise to bring them into balance, while the Americas are a deficit area and most of those currencies must fall to bring them to balance. Europe is a surplus area and most of its currencies rise by double-digit amounts against the dollar.
The scale of the changes would be quite large, indicating how far currencies have become misaligned in recent years. For example, the Japanese yen would move from the October 2021 level of 113 to the dollar to 81 to the dollar, making U.S. products much more competitive against Japanese products. The Chinese yuan would rise from 6.42 to the dollar to 5.28 to the dollar. The yuan has not been at such a high level since before the historic 1994 Chinese devaluation which set the stage for China’s huge increase in manufacturing production and exports. The euro would move from $1.16 to $1.48, a 27.3% increase.
The net effect on U.S. competitiveness would be to make us 16.6% more competitive on a global basis. But that number includes minor exchange rate adjustments against nations in the Americas. The adjustments of the dollar against many of our large bilateral deficit nations such as China and the European Union would be large.
It should be added that all these estimates are based on IMF projections of national current accounts and GDP which are of course subject to error. For example, the IMF study shows the U.S. 2021 current account deficit for 2021 at 3.5% of GDP. The IMF forecasts this deficit will decline to 2.4% of GDP by 2026, closer to our historic levels (IMF, 2021c). The IMF explains its thinking in its July 2021 report (IMF 2021c) where it says that the U.S. deficit will decline as COVID-related fiscal deficits shrink. Fiscal deficits have already begun to shrink. But there is room for doubt about whether the U.S. current account deficit will actually shrink by a full percentage point of GDP as the IMF forecasts. A larger U.S. current account deficit would require a larger realignment of the dollar.
Table 1: Global Exchange Rates in 2021 and Changes Required to Move to Global Equilibrium. A positive percentage change means revaluation against the dollar; negative means devaluation.
| Dollar Exchange Rate | FEER- consistent dollar rate | ||
| Country | Oct 2021 | Percentage Change | |
| Pacific | |||
| Australia* | 0.74 | 21.0 | 0.90 |
| New Zealand* | 0.71 | 7.6 | 0.76 |
| Asia | |||
| China | 6.42 | 21.7 | 5.28 |
| Hong Kong | 7.78 | 30.8 | 5.95 |
| India | 75.0 | 5.6 | 71.0 |
| Indonesia | 14179 | 12.4 | 12613 |
| Japan | 113 | 40.2 | 81 |
| Korea | 1182 | 31.3 | 900 |
| Malaysia | 4.16 | 32.3 | 3.15 |
| Philippines | 50.7 | 16.7 | 43.4 |
| Singapore | 1.35 | 51.4 | 0.89 |
| Taiwan | 27.9 | 48.0 | 18.9 |
| Thailand | 33.5 | 27.5 | 26.2 |
| Vietnam | 23168 | 23.4 | 18530 |
| Middle East/Africa | |||
| Israel | 3.21 | 27.3 | 2.53 |
| Saudi Arabia | 3.75 | 15.8 | 3.24 |
| South Africa | 14.85 | 9.6 | 13.55 |
| Europe | |||
| Czech Republic | 22.0 | 25.3 | 17.5 |
| Euro area* | 1.16 | 27.3 | 1.48 |
| Hungary | 311 | 25.9 | 247 |
| Norway | 8.46 | 27.5 | 6.63 |
| Poland | 3.96 | 20.2 | 3.29 |
| Russia | 71.3 | 29.4 | 55.1 |
| Sweden | 8.67 | 29.2 | 6.71 |
| Switzerland | 0.92 | 30.7 | 0.71 |
| Turkey | 9.21 | 13.8 | 8.09 |
| United Kingdom* | 1.37 | 9.6 | 1.50 |
| Western Hemisphere | |||
| Argentina | 99.25 | 11.2 | 89.29 |
| Brazil | 5.53 | -12.6 | 6.33 |
| Canada | 1.24 | -0.9 | 1.26 |
| Chile | 814 | 8.7 | 749 |
| Colombia | 3773 | -14.5 | 4412 |
| Mexico | 20.5 | 3.2 | 19.8 |
| United States | 1.00 | 0.0 | 1.00 |
| Venezuela | … | 2.2 | … |
(*) Exchange rate is given in dollars per foreign currency All others are foreign currency per dollar.
Conclusion
The study shows that very large changes in exchange rates in the U.S. and other major nations would be required to achieve global balance. At current U.S. dollar values, U.S. producers are operating at a disadvantage greater than 20% with many of our largest trading partners, including China, Japan, South Korea, and the 19-member Eurozone. In that context, efforts to boost American production and relocate foreign supply chains back to the U.S. are very difficult and in many cases likely doomed to fail.
Policies aimed at boosting U.S. production should begin by addressing the fundamentally misaligned value of the dollar, either through unilateral action or multilateral action. The Market Access Charge, which would tax capital inflows into the U.S. would enable the federal government unilaterally to manage the dollar to a competitive level. This policy tool, proposed in the Baldwin-Hawley Competitive Dollar for Jobs and Prosperity Act in the last congress, would empower the Federal Reserve to manage the dollar to achieve global competitiveness.
The CPA analysis of global exchange rates also shows the appeal of a multilateral solution. Nations that would gain from a thorough overhaul of the global currency system include not just the U.S., but also the UK., Australia, India, Brazil, Colombia, and New Zealand. One of the hallmarks of the Bretton Woods system agreed under American leadership by 44 nations in 1944 was severe restrictions on international capital movements. Nations agreed to those restrictions because capital flows were seen as an important cause of the global depression of the early 1930s. Also, looking forward, the Bretton Woods delegates in 1944 knew that unchecked capital movements would make it difficult to fix and hold exchange rates at fair levels and lead to periods of large destabilizing capital flows. Such destabilizing flows did occur numerous times once major nations moved to floating exchange rates in 1973, most notoriously in the Asian financial crisis of 1997. A return to fixed or pegged exchange rates would require leadership which would likely need to be American, and would require asserting control over the financial industry which profits from unrestrained global capital movements. It need not entail any restrictions on cross-border investments in real industry.
Until the persistent disadvantage for U.S. producers built into modern currency markets is confronted, it remains doubtful if the U.S. economy can restore the productive potential and growth rates it enjoyed before 1973.
With thanks to William Cline.
References:
William R. Cline, Estimates of Fundamental Equilbrium Exchange Rates, November 2017. Peterson Institute for International Economics, November 2017.
International Monetary Fund. 2021. External Sector Report: Divergent Recoveries and Global Imbalances. Washington, DC, August. (IMF, 2021a)
International Monetary Fund. 2021. World Economic Outlook: Recovery during a Pandemic—Health Concerns, Supply Disruptions, Price Pressures. Washington, DC, October. (IMF, 2021b)
International Monetary Fund. 2021. United States 2021 Article IV Consultation. IMF Country Report No. 21/162. (IMF, 2021c)