Key Points
- In 2019, Mexico agreed to refrain from increasing steel shipments to the U.S. in return for the U.S. dropping the 25% tariffs pursuant to Section 232. Mexico continues to violate its side of the agreement as shipments of steel/iron products have surged far above agreed upon levels.
- Mexico’s increased shipments now account for over 87% of U.S. imports of steel conduit and import levels are 472% over the historic baseline
- Mexico has also increased steel imports from China at the same time. Chinese steel is likely to be a substantial portion of Mexican shipments to the U.S.
- Steel product manufacturing employment stalled due to the import surge and has now started to fall.
- The impact of job losses will be compounded by downstream economic effects on the supply chain, service jobs, local government and school districts, and more.
- In total, over one million jobs nationwide are at risk, especially jobs dependent on the steel industry.
OVERVIEW
There has been a great surge in steel and steel product imports from Mexico into the U.S. in recent years. Mexico has also increased its steel imports from China, a substantial fraction of which are likely to be shipped tariff-free into the U.S. The two largest exporters to the United States for steel/iron articles (China and Mexico) together make up 38% of U.S. steel/iron article imports.
The 2019 Joint Statement on Steel and Aluminum[1] was signed because Mexico refused to finalize the newly negotiated U.S. Mexico Canada Agreement unless the 232 steel and aluminum tariffs previously imposed by President Trump were resolved. That agreement stated, at its core, that the U.S. would drop its 25% tariffs on steel and 10% tariffs on aluminum in return for Mexico’s agreement to prevent import volumes that exceeded historic baseline levels. The historic level is the 2015 to 2017 average of shipments.
The Agreement further provided that if Mexico breached, the U.S. could, after consultations, reinstate the tariffs.
In 2020 and 2021, Mexico began violating the agreement with dramatically increased shipments. Today’s volumes are even higher. While there have been negotiations between the Biden and Obrador administrations, those negotiations have not resulted either in an agreement or in a decision from Biden to enforce the previous agreement. CPA has long stated that trade deals like this one must be enforced, or they are of no use.
This paper shows the extent of the continuing violation by Mexico as well as the worsening economic harm occurring in local communities, including so-called “swing states”.
THE EXTENT OF MEXICO’S IMPORT SURGE VIOLATION BY VALUE AND VOLUME
In 2020, after the Joint Statement was signed, Mexico largely complied as shipments to the US declined from 2019. However, by 2021, overall steel shipments jumped dramatically as shown in Figure 1 and Table 1. Official U.S. Census data shows that total steel product imports from Mexico in 2023 have risen to 36% over the 2015-2017 baseline, and initial 2024 trade data suggests imports will rise again in 2024. However, as we will see with steel conduit imports, this figure is likely being severely underreported. Additionally, Mexican steel producers are also continuing to grow their production facilities, with many plants announcing expansions in 2023 and 2024 that will further increase production at Mexican facilities by as much as 38% in the upcoming years.[2], [3]
Figure 1:
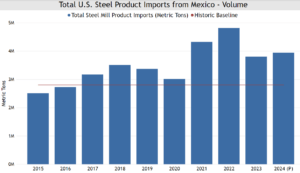
Source: Steel Import Monitoring and Analysis (SIMA), U.S. Department of Commerce, Enforcement and Compliance[4]
Table 1: Volume of Steel Imports to the U.S. from Mexico (Benchmark versus 2023)
| Steel Product | Benchmark Period (2015-2017) |
2021 Imports | 2022 Imports | 2023 Imports | 2023 Compared to Baseline |
| Total Steel Mill Products | 2.8 M | 4.3 M | 4.8 M | 3.8 M | 36% over baseline |
Source: Steel Import Monitoring and Analysis (SIMA), U.S. Department of Commerce, Enforcement and Compliance
Breaking out the data among types of steel products, as shown in Figure 2, one can see how the increases are across various product categories, from stainless to semi-finished steel to pipe and tube products. All of these categories have U.S. production and support high-quality jobs in local communities.
Figure 2:
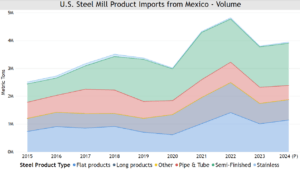
Source: Steel Import Monitoring and Analysis (SIMA), U.S. Department of Commerce, Enforcement and Compliance
When one considers the dollar value of the steel products being shipped in the official data, the surge violation is even more stark. Chapter 72 of the Harmonized Tariff System contains basic iron and steel products while Chapter 73 includes value-added products made from iron and steel.
As shown in Table 2, Mexico’s shipments of Chapter 72 iron and steel products are 134% over the historic baseline, for purposes of the Joint Statement. While articles made of iron and steel, such as pipe, tube and wire, have seen 2023 shipments exceed the baseline by 86%.
Table 2: Value of Steel Imports to the U.S. from Mexico (Benchmark versus 2023)
| Steel Product | Benchmark Period (2015-2017) |
2021 Imports | 2022 Imports | 2023 Imports | 2023 Compared to Baseline |
|
Iron & Steel (Chapter 72) |
$1.5 B | $4.5 B | $5.4 B | $3.6 B | 134% over baseline |
|
Articles Made of Iron & Steel (Chapter 73) |
$4.2 B | $6.4 B | $8.1 B | $7.8 B | 86% over baseline |
Source: U.S. Census Bureau (General Customs Value, HTS 72 & 73)
Within the greater Mexican steel import wave, certain steel products have had even more severe upsurges. Steel conduit is an especially egregious example. Steel conduit is used as a raceway system for electrical conductors, carrying electrical wires. It is installed in the construction of commercial and industrial buildings across the United States. Official U.S. Census Bureau data shows that 2023 shipments of Mexican steel conduit have more than doubled since baseline years by volume. And initial 2024 trade data suggests steel conduit imports from Mexico will rise again in 2024.
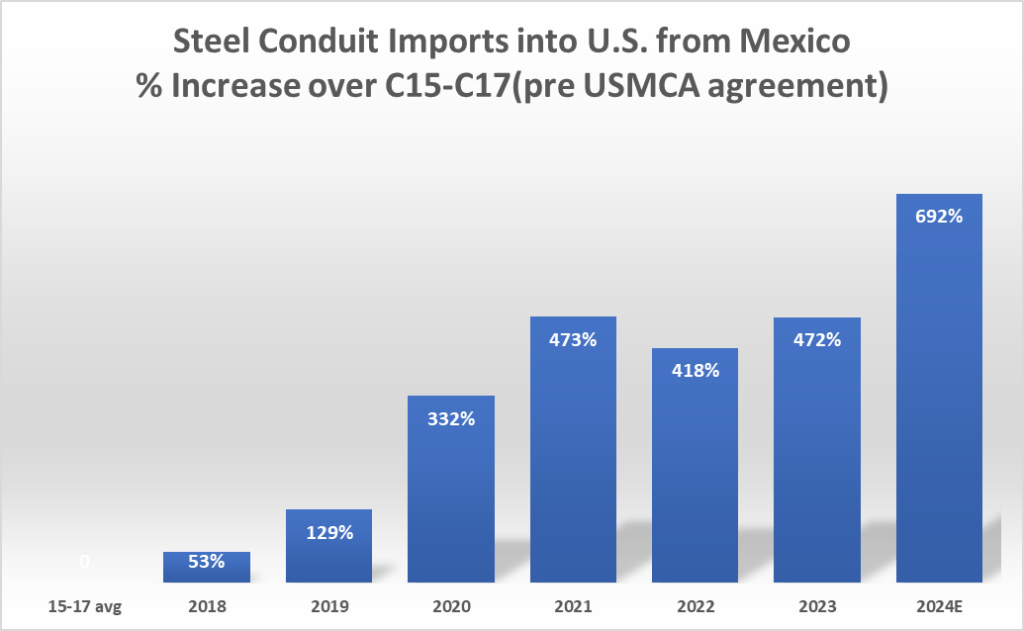
However, this census data is only the officially reported figures. Mexican firms have consistently misclassified steel conduit imports under various HS product codes in recent years, underreporting the true scale of the steel product surge. As shown in Figure 3, the true scale of the steel surge is even greater. For steel conduits specifically, imports from Mexico reached 472% above the 2015-2017 baseline period, based on Panjiva data. Initial 2024 trade data suggested the surge will rise to 692% over the baseline in 2024. Mexican producers are likely misclassifying many other steel products coming into the United States as well, meaning the true surge across the various steel products is likely far above the officially reported volumes.
Figure 3:

Source: Panjiva – Global Trade Insights (Volume – Metric Tons)[5]
Mexico also has a dominant share of total steel conduit imports compared to other importers. Mexico’s share of steel conduit imports is currently at 87% of global imports to the United States by volume.
As shown in Table 4, all categories of steel product imports from Mexico are now far above their historic baselines from the USMCA negotiations by value as shown in U.S. Census data. Steel conduit, wire of stainless steel, semi-finished products, and other structures/parts of structures are among the steel categories with the largest increases. Just as with the overall Chapter 72 and 73 steel imports, the surge violation is even greater when looking at the increase in import value.
Table 4: Value of Selected Steel Import Subcategories to the U.S. from Mexico
(Benchmark versus 2023)
| Steel Product | Benchmark Period (2015-2017) |
2021 Imports | 2022 Imports | 2023 Imports | 2023 Compared to Baseline |
|
[Steel Conduit] Other tubes, pipes, and hollow profiles, internally coated or lined (not exceeding 114.3 mm) (HTS 7306.30.5028) |
$13.6 M | $55.8 M | $68.9 M | $53.9 M | 295% over baseline |
|
Flat-rolled products (width of 600 mm or more, hot-rolled) (HTS 7208) |
$168.2 M | $436.1 M | $736.6 M | $298.5 M | 77% over baseline |
|
Wire of stainless steel (HTS 7223) |
$0.6 M | $0.2 M | $2.6 M | $3.0 M | 412% over baseline |
|
Other structures and parts of structures (HTS 7308) |
$519.9 M | $1,306.9 M | $1,879.6 M | $1,806.3 M | 247% over baseline |
|
Semifinished products of iron (HTS 7207) |
$218.7 M | $745.4 M | $680.0 M | $443.9 M | 103% over baseline |
|
Other tubes, pipes and profiles (HTS 7306) |
$350.5 M | $510.1 M | $717.6 M | $607.8 M | 73% over baseline |
Source: U.S. Census Bureau (General Customs Value)
THREAT TO U.S. MANUFACTURING JOBS, INVESTMENTS, AND LOCAL ECONOMIES
Even though the U.S. steel industry has suffered great losses over the past decades due to growing imports from abroad, the industry is by no means gone. The U.S. steel/iron industry employs 143,500 people nationwide, including 75,000 jobs in the Midwest alone.
Figure 4:
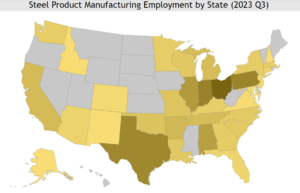
Source: U.S. Bureau of Labor Statistics, Occupational Employment and Wage Statistics[6]
The U.S. steel industry is still strongest in the Midwest (particularly in Ohio, Pennsylvania, Indiana, Michigan, and Illinois), as shown in Figure 4. U.S. steel industry employment has even been trending upwards in the last three years. In mid-2023, U.S. steel product manufacturing employment finally recovered to pre-pandemic levels, powered by substantial committed investments in U.S. manufacturing.
One major example is Zekelman Industries, the largest independent steel pipe and tube manufacturer in North America, which has been a positive force for this growth, investing and expanding its U.S. manufacturing footprint across the country. In recent years, Zekelman Industries invested over $100 million towards an expansion of their Rochelle, Illinois facility, which resulted in hiring over 250 new employees.[7]
CPA has learned from other member steel companies that they have hundreds of millions of dollars of investment in new plants or production lines on hold because the U.S. market will not support both a Mexico import surge and increased domestic production.
Therefore, the continuing stream of steel product imports into the U.S. is derailing further domestic job and investment growth. And the profitability of existing investments in plants and production lines is eroding because of reduced capacity utilization. As shown in Figure 5, steel product manufacturing employment growth stalled in late 2023 and is now at risk of collapsing. The 3-month growth in employment fell to near 0% by September 2023. And the recently released February 2024 employment data showed steel product manufacturing down 1.8% compared to three months before, the worst job loss in three years.
Figure 5:
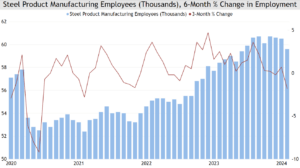
Source: U.S. Bureau of Labor Statistics, Employment, Hours, and Earnings from the Current Employment Statistics survey (National)[8]
The swell in steel imports from countries like Mexico is one of the major drivers of this worsening employment trend. The import surge has a direct negative effect on the competitiveness of U.S. firms and consequentially the financials that support employment. Especially in the case of imports from Mexico (such as with steel conduit), foreign producers can undermine U.S. steel product manufacturers on price, pricing as low as 25% below prevailing prices in the U.S. market. Mexican companies are able to do this because they are exempt from the U.S. steel tariffs owed by nearly all other countries with similarly low labor and production costs.
In addition, Mexican steel product manufacturers may be receiving support from the Mexican government. The U.S. Department of Commerce has previously found that the Mexican government was providing subsidies to Mexican producers and exporters of certain fabricated structural steel.[9] The true scale of the Mexican government’s support for its many steel product exporters is unknown, but the rapid upsurge of Mexican steel product exports, below U.S. market prices, and history of Mexican government subsidies for steel producers points to a strong likelihood of some level of involvement.
In recent years, Mexico has also received significantly more steel product imports from countries subject to steel tariffs such as China and India. Despite domestic demand growth in Mexico only rising about 13% from 2015 to 2023,[10] steel/iron imports from all countries rose by 84%. And this increase is even greater for imports from China and India. Mexican imports of both Chinese and Indian steel/iron products have doubled from 2015 to 2023. As shown in Figure 6, Mexican steel imports from China and India began swelling in 2021, just as Mexican steel exports to the United States began surging as well. Even though Mexico claims that less than 1% of its steel exported to the U.S. is melted and poured in countries subject to U.S. steel tariffs,[11] this great surge in Mexico’s steel imports from countries like China and India at exactly the same time as its export surge to the United States suggests there may be a high level of masked Chinese and Indian steel making its way through Mexico to avoid steel duties.
Figure 6:
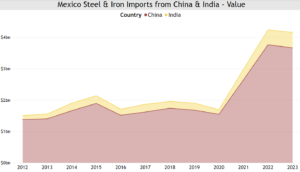
Source: United Nations Comtrade Database (HS Chapters 72 & 73; Value – USD)[12]
The huge strain on local U.S. steel product manufacturers from these imports is already causing closures and job losses. The Mexican steel conduit import issue directly led to the closure of Zekelman Industries’ Long Beach mill, with the loss of 150 jobs.[13] Furthermore, according to Zekelman’s President of Electrical Products Jim Hays, additional capital for new plants, expansions, and equipment (similar to the Rochelle, Illinois expansion) has been put on hold until action is taken to curtail the dumping of steel conduit and other pipe and tube products into the United States.
The import issue has the risk of escalating if nothing is done to address the surge. If steel product imports remain at their current dangerously high levels, more high-quality high-paid U.S. jobs will be lost. Moreover, the upstream and downstream effects of closures and canceled expansions will compound the negative economic impact and it will be felt deeply in the local communities where the steel product manufacturers are located.
Steel manufacturers and their employees are vital to their local communities as well as their broader state economies. All jobs cause economic ripple effects that influence the rest of the labor market. However, the size of this employment multiplier ripple effect differs between types of jobs, and durable manufacturing employment (which includes steel product manufacturing) has one of the largest employment multiplier effects. According to the Economic Policy Institute, every 100 direct durable manufacturing jobs, supports 744 indirect jobs.[14] Based on this employment multiplier effect, the 143,500 national steel manufacturing jobs support about 1.07 million indirect U.S. jobs nationwide, including 558,000 U.S. jobs across the Midwest alone. Any loss in business and market share (and consequently jobs) among U.S. steel product manufacturers will be compounded more than sevenfold.
The direct negative impact on the U.S. suppliers of the steel industry will be felt across many different industries. The Economic Policy Institute found that every 100 direct durable manufacturing jobs support 289 supplier jobs. This includes businesses such as materials suppliers and capital services. For example, when U.S. steel conduit producers are undermined by conduit from Mexico, all the U.S. steel coil producers, transportation companies, strapping suppliers, equipment buildings, and other U.S. companies in the supply chain suffer economic losses as well. Over the long-term, jobs in these areas would also become affected if the import surge is not curtailed.
Moreover, employment losses among manufacturers also cause negative impacts on downstream induced jobs. These induced jobs are supported by the re-spending of income received from both direct jobs and supplier jobs, in addition to the public service jobs supported by tax revenue. For example, steel manufacturing and steel supplier jobs support leisure and hospitality and other service jobs in their communities across the United States. Manufacturing companies provide a crucial tax base for local and state governments and school districts, supporting the employment of teachers, fire and police forces, and other public services. The Economic Policy Institute found that every 100 direct durable manufacturing jobs support 455 induced (service sector / public service) jobs. If key manufacturers are forced to cut jobs or cancel expansion plans, the local communities that depend on the manufacturers suffer immensely as well. Especially in the Midwest and other areas where steel product manufacturers are concentrated, the impact of employment losses from the steel import surge would have lasting ripple effects, similar to how the service industry and the broader economy suffered immensely after COVID closures. This effect has been repeatedly seen in historic manufacturing towns across the United States as imports forced U.S. producers to close plants and cut jobs over the past decades.
CONCLUSION
The U.S. government must address Mexico’s clear violation of the Joint Statement to protect the integrity of trade agreements and to preserve U.S. jobs and the economic health of local communities. Due to large and continuous investments in American employees, facilities, and equipment, U.S. steel product manufacturing has been able to recover from the economic low of the COVID crisis. This investment in American communities has supported over one million jobs across the country.
However, this investment and many planned future investments are now stalling out. Mexican steel imports flooding into the United States are substantial cause of this problem. Steel product manufacturing jobs are already starting to trend downwards, which will have direct impacts on downstream jobs and local communities, especially in the Midwest steel states.
[1] Joint Statement by the United States and Mexico on Section 232 Duties on Steel and Aluminum, https://ustr.gov/sites/default/files/Joint_Statement_by_the_United_States_and_Mexico.pdf
[2] Kmemmel. 2024. “Mexico’s Conduit Rymco Will Expand Steel Tubing Plant With $45 Million.” January 19, 2024. https://www.steelorbis.com/steel-news/latest-news/mexicos-conduit-rymco-will-expand-steel-tubing-plant-with-45-million-1324345.htm.
[3] “BNamericas – Ternium Confirms Pesquería for Its New Mexic…” n.d. BNamericas.Com. https://www.bnamericas.com/en/news/ternium-confirms-pesqueria-for-its-new-mexico-slab-mill.
[4] “Steel Import Monitor.” n.d. International Trade Administration | Trade.Gov. https://www.trade.gov/steel-import-monitor.
[5] “Panjiva – Global Trade Insights — Panjiva.” n.d. © 2024 S&P Global. https://panjiva.com/.
[6] “Occupational Employment and Wage Statistics.” n.d. U.S. Bureau of Labor Statistics. https://data.bls.gov/oes/#/home.
[7] “Zekelman Industries Introduces New Rally Cry: BELIEVE IN WHAT YOU BUILDTM | Zekelman Industries.” February 23, 2024. https://www.zekelman.com/news/zekelman-industries-introduces-new-rally-cry-believe-in-what-you-build/.
[8] “Employment, Hours, and Earnings from the Current Employment Statistics survey (National).” n.d. U.S. Bureau of Labor Statistics. https://beta.bls.gov/dataViewer/view/timeseries/CEU3133120001.
[9] “Certain Fabricated Structural Steel From Mexico: Final Affirmative Countervailing Duty Determination.” 2020. Federal Register. January 30, 2020. https://www.federalregister.gov/documents/2020/01/30/2020-01723/certain-fabricated-structural-steel-from-mexico-final-affirmative-countervailing-duty-determination.
[10] “GDP And Spending – Domestic Demand Forecast – OECD Data.” n.d. theOECD. https://data.oecd.org/gdp/domestic-demand-forecast.htm.
[11] “Melt and Pour Dashboard.” n.d. International Trade Administration | Trade.Gov. https://www.trade.gov/data-visualization/melt-and-pour-dashboard.
[12] “Comtrade Database.” n.d. United Nations. https://comtradeplus.un.org/.
[13] Zekelman Industries. 2023. “Zekelman Industries Announces Closure of Factory in Long Beach, California | Zekelman Industries.” November 28, 2023. https://www.zekelman.com/news/zekelman-industries-announces-closure-of-factory-in-long-beach-california/.
[14] “Updated Employment Multipliers for the U.S. Economy.” n.d. Economic Policy Institute. https://www.epi.org/publication/updated-employment-multipliers-for-the-u-s-economy/.