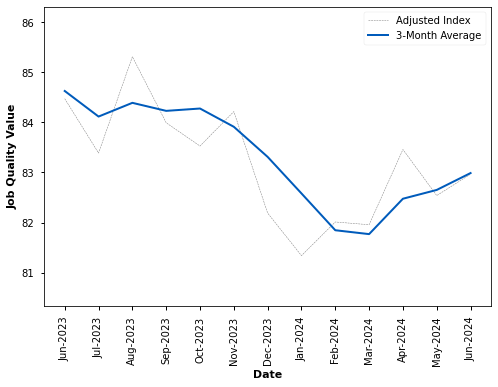
WASHINGTON — The Coalition for a Prosperous America (CPA) today announced that the U.S. Private Sector Job Quality Index (JQI) was 82.99, up by +0.41% from the preceding month. Despite this slight increase in the JQI, the overall July 2024 Jobs Report from the government’s Bureau of Labor Statistics showed weak job growth. Employment was up 114,000 jobs (well below expectations of 175,000 new jobs).
When only looking at private sector job growth, July’s employment growth is even worse, only adding 97,000 jobs. Furthermore, employment growth from June was revised down to 179,000 (from 206,000) and May’s job growth was revised down to 216,000 (from 218,000). Unemployment also rose again, reaching 4.3% (up from 4.1% last month). This is the highest unemployment rate since October 2021. The poor jobs report adds to evidence of cooling in the economy as continuing inflation and high interest rates bite into spending and the 2024 presidential election comes ever closer.
The JQI, developed by CPA in partnership with other economists, divides the U.S. private sector nonmanagement labor force of 109.6 million employees into 16 sectors and 164 subsectors to evaluate economic trends in national employment. Sectors where the average weekly wage is above the average weekly wage for this group are termed “high-quality jobs” and those below are “low-quality jobs.” The data shows that for over 30 years the U.S. economy has created more low-quality jobs than high-quality.
The slight increase in the JQI is caused by a higher proportion of the jobs gained being in high-quality job categories. However, with the total employment growth continuing to slow, the total opportunities per job seeker are shrinking nonetheless. The top high-quality job categories only managed slight increases in employment from May to June. These high-quality job sectors with the best growth include Insurance Carriers (up 0.42%), Architectural/Engineering (up 0.40%), Agencies, Brokerages, and Other Insurance-Related Activities (up 0.37%), and Hospitals (up 0.36%). High-quality job categories also did not experience many job losses. Only Fabricated Metal Product Manufacturing experienced a decrease in employment (down 0.09%).
Among low-quality job sectors, Individual and Family Services (up 0.71%) and Services to Buildings & Dwellings (up 0.47%) had the largest employment increases in June, better growth than any of the top high-quality job categories. However, low-quality job categories also had worse employment losses. The largest losses were Traveler Accommodation (down 0.51%), Amusement, Gambling, and Recreation Industries (down 0.28%), and Full-Service Restaurants (down 0.18%).
Overall Manufacturing employment grew slightly in July, adding 1,000 new jobs and raising the total to 12.953 million. However, total manufacturing employment is still down by 13,000 jobs since January 2024. High-quality manufacturing jobs (up 0.24%) had better growth than low-quality (up 0.01%) in June, but overall growth in either category was mediocre. The best-performing manufacturing sector by far was the high-quality job category of Chemical Manufacturing, where employment rose by 0.81%. The next best high-quality manufacturing job categories were Computer and Electronic Product Manufacturing and Paper Manufacturing, with employment rising 0.39% and 0.35% respectively.
Meanwhile, high-quality manufacturing jobs with employment losses include Fabricated Metal Product Manufacturing (down 0.09%) and Electrical Equipment, Appliance, and Component Manufacturing (down 0.15%). Low-quality manufacturing employment was flat, with employment gains in sectors such as Apparel Manufacturing (up 0.48%) being roughly canceled out by losses in sectors such as Furniture and Related Product Manufacturing (down 0.46%).
The total average weekly income was essentially flat for July, falling by 0.1% to $1,199.39 for the 110.12 million total private sector employees. Both high-quality and low-quality jobs saw increases in weekly income in the June JQI data, however. High-quality jobs saw a 0.41% increase, and low-quality jobs saw a 0.32% increase. The biggest contributors to the high-quality job weekly income growth were Transportation Equipment Manufacturing (up 1.15%) and Building Equipment Contractors (up 0.83%). Among low-quality jobs, Skilled Nursing Care Facilities (up 1.13%) and General Merchandise Retailers (up 1.08%) were the largest contributors to the weekly income gains.
For high-quality manufacturing jobs, overall weekly income growth rose 0.75%. Paper Manufacturing and Electrical Equipment, Appliance, and Component Manufacturing experienced the strongest weekly income growth at 2.70% and 2.06% respectively. Meanwhile, high-quality manufacturing job income losses were smaller. Only Chemical Manufacturing (down 1.07%) and Fabricated Metal Product Manufacturing (down 0.43%) saw losses in weekly income.
Weekly income rose even more for low-quality manufacturing jobs, increasing by 0.91%. The biggest contributors to this wage growth were Textile Product Mill Manufacturing (up 1.64), Furniture and Related Product Manufacturing (up 1.40%), and Printing and Related Manufacturing (up 1.37%). No low-quality manufacturing job categories saw a decrease in average income.
Figure 1. Job Quality Index 1990-2024