


Summary
- Americans are working harder and waiting longer to buy homes
- The cost of a home is 6 times median household income today, versus 3.2 times in 1967
- The disparity between house prices and median incomes was exacerbated by the COVID pandemic which drove a 37% increase in house prices in three years.
- The growing un-affordability of houses reflects the stagnation of median household income and the artificial support of asset prices in the 21st
- The pandemic widened the home to income un-affordability gap disproportionately more for women and minority workers.
- Housing is less affordable in the U.S. than in the majority of OECD countries
Homes are less affordable today than in previous generations
Median home prices have grown faster than household income over the past 50 years. Figure 1 shows the U.S. median home price and income from 1967 to 2022. In 1967, home prices were $22,700 and median income was $7,143 meaning that home prices were 3.2 times larger than income. In 2022, the median home price is $440,300 and income is an estimated $75,200. This means that in 2022 home prices were 6 times larger than household income. Since 1967, income rose by 953% while house prices surged by 1,839%. Overall, homes have become significantly less affordable for the median household today than in previous generations.
A major factor driving the steady rise in home prices has been the Fed’s policy of low interest rates. Low interest rates make borrowing more affordable, making it easier for consumers to finance the purchase of homes. However, low interest rates also increase demand for assets, particularly in a world where banks have plenty of money to lend. This asset price effect has driven up the price of houses as well as financial assets such as stock market prices. Research on the relationship between interest rates and home prices reveals that home prices are very sensitive to changes in the interest rate. [1] Interest rates do not have this direct of an effect on current household incomes, contributing to the diverging growth rates between the two over time.
Figure 1: Median Home Price and Median Household Income
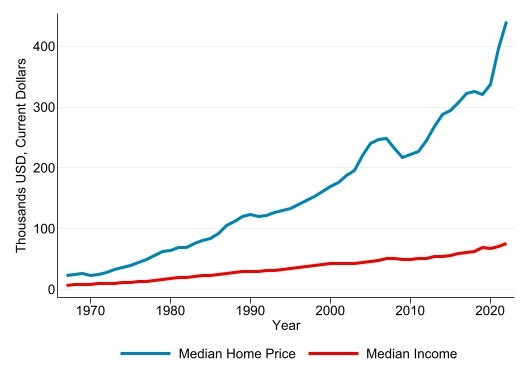
Source: Median household income and home prices from the U.S. Census Bureau; CPI data from U.S. Federal Reserve Bank of Minneapolis, CPA calculations. Median income data not available for 2022, imputed value for missing year based on 2021 level and 2022 core inflation rate 6.3%.
U.S. interest rate policy has been to hold interest rates at very low levels since around 2004. This policy was implemented by Ben Bernanke, chairman of the Federal Reserve board from 2006-2014, and then continued by Janet Yellen and Jerome Powell until its reversal in 2021. The low interest rate policy reflected in part by the Federal Reserve’s belief that low interest rates were needed for most of the last two decades to offset the deflationary effects of the trade deficit, due to globalization and especially China’s rise as a manufacturing power targeting the U.S. market. Bernanke explained this in detail in a series of articles published in 2015. This excerpt reveals his thinking:
“A global excess of desired saving over desired investment, emanating in large part from China and other Asian emerging market economies and oil producers like Saudi Arabia, was a major reason for low global interest rates. I argued that the flow of global saving into the United States helped to explain the “conundrum” (to use Alan Greenspan’s term) of persistently low longer-term interest rates in the mid-2000s while the Fed was raising short-term rates. Strong capital inflows also pushed up the value of the dollar and helped create the very large US trade deficit of the time, nearly 6 percent of US gross domestic product in 2006. The diversion of 6 percent of domestic demand to imports provides an alternative explanation to secular stagnation for the failure of the US economy to overheat in the early 2000s, despite the presence of a growing bubble in housing.”[2]
Although the Federal Reserve raised short-term rates at various times between 2004 and 2021, those rate increases had a very limited effect on long-term interest rates, which are more market-driven. The effect of this policy was to increase asset prices, including house prices.
Homes are less affordable for younger families
According to the U.S. Census, home ownership among younger families has declined over the past several decades. In 1982, 19% of homeowners were 35 or younger. In 2021 only 12% of owners were 35 or younger.[3] The median age of a first-time homebuyer has increased from 29 in 1981 to 33 in 2019, showing houses moving out of reach for young families. Since 2019, that median age must have risen further considering the acceleration in home price inflation. Since 1981 the median age of all homebuyers including repeat homebuyers has increased from 31 to 47 in 2019.[4] This is presumably due to people buying and selling homes more often since there is more opportunity to realize gains than before 1981 when house prices were more stable.
Home prices grew even faster during the Pandemic, not incomes
Home prices soared during the COVID-19 pandemic as both supply and demand side factors raised home prices. Median home prices increased from $321,000 in 2019 to $440.300 in 2022, reflecting a 37% increase since the pandemic began. The overall change was large as home prices do not often grow so quickly. For instance, home prices between 2016 and 2019 increased by only ~4%.
There are multiple factors that pushed home price up during the pandemic. First, there was an increase in demand for homes which causes higher prices. Lower interest rates due to Federal Reserve policy and the global savings glut made borrowing became cheaper and increased the demand for homes. To understand the effect, consider that you buy a home for $400,000 before the pandemic. Before COVID, you could get a 4% interest rate and would end up paying $687,000 in principal and interest over 30 years. However, during COVID interest rates fell to 2.65%, your bill would be $580,000, which is over $100,000 cheaper. This example shows how a seemingly small few percentage points change in the home interest rate can influence major financial decisions for individuals.
The reduced supply for homes also raised prices. COVID made it more difficult to build homes due to worker shortages and higher prices for inputs (timber, materials, etc). Further, there were fewer individuals who wanted to sell their home during COVID, reducing the inventory of available homes and further raising prices.
While home prices grew by 37%, median income rose by 10% from $68,703 in 2019 to our estimate of $75,243 in 2022.[5] With millions of job losses and widespread illnesses and deaths, COVID severely restricted the labor market and reduced household incomes. COVID caused major layoffs especially in service sector industries due to public safety mitigation measures and social distancing.
The double-digit growth in home prices was hardest for low-paying workers who experienced the worst effects from COVID. The negative effects of the COVID pandemic were more concentrated (84%) on lower-income workers ($52,000 or less) than higher income. [6] Overall, workers in the restaurant industry saw the largest decline in full-time jobs.[7] Service sector industries were more negatively impacted because they are not able to accommodate remote work and have more contact exposure than others. The restaurant industry, for instance, is a high-contact industry and firms in this industry were forced to either shut down or offer takeout services.
With COVID winding down, home prices have started to fall again. This change does not mean that homes are becoming more affordable because the recent jump in home prices was driven by COVID-related events. The overall long running trend of diverging income and home prices is likely to continue.
The pandemic widened the home to income un-affordability gap disproportionately for women and minority workers.
Women workers are more concentrated in-service sector and low-paying industries and were disproportionately affected by the pandemic. The pandemic also forced k-12 schools and childcare services to shut down, forcing parents, particularly mothers, to exit the labor force and adding a further disproportionate effect on women workers.[8]
The pandemic also widened the home to income un-affordability gap for minorities. While Black Americans represent only 12% of the population, they have a higher rate of COVID infection per 100k people than white Americans.[9] [10] This phenomenon is often referred to as racial disparities in health statistics. These same racial disparities are prevalent among economic indicators as well. For instance, the CPA Job Quality Index for minorities shows that while Black Americans have 13% of the workforce, they only get 8% of the high quality (well paying) jobs and twice as many (17%) of the low-quality ones. This level of job quality is half as much as the average worker in the U.S. Black Americans work a disproportionate share of the low-paying service sector jobs that were also some of the hardest hit by COVID. For instance, Black Americans represent 29% of the home health care service and 28% of nursing care facility workforce.[11]
Similarly, Hispanic Americans comprise only 18% of the total workforce and 28% of the lower-paying restaurant industry—which was also one of the most negatively affected industries during COVID. Overall, minorities faced a disproportionate share of the negative economic and health effects from COVID, making necessities like home ownership disproportionately difficult to afford.
We have disproportionately focused on low prices as a measure of economic well-being and forgot about real measures such as job quality, real incomes, real wealth, and equitable income distribution.
The affordability of the middle-class lifestyle has changed in many ways. While everyday consumer goods are more affordable today than in the 1960’s, middle class households are less able today to afford a home, send a child to college, or pay for medical bills. Our heavy exposure to global markets and free trade policies has benefitted international traders including banks and MNC’s all-the while forcing thousands of locally owned businesses to close. Low prices made the movement of wealth from individuals into corporations and other countries more consciously tolerable.
The Job Quality Index, developed by CPA and now part of a joint venture with Buffalo University measures job quality as defined as the ratio of U.S. private sector production workers with weekly incomes above the average weekly income for all production workers to those below the average. Figure 2 shows how U.S. households have seen decades of declining Job Quality and rising inequality as good paying manufacturing jobs are offshored. The Job Quality Index[12] (JQI, left axis) produced by the Coalition for a Prosperous America is correlated with higher inequality, measured by the Gini Coefficient (right axis). The Gini Coefficient is a measure of inequality used by economists. A higher Gini indicates greater inequality.
Figure 2: Income Inequality Increasing and Falling Job Quality Overtime, 1990-2022
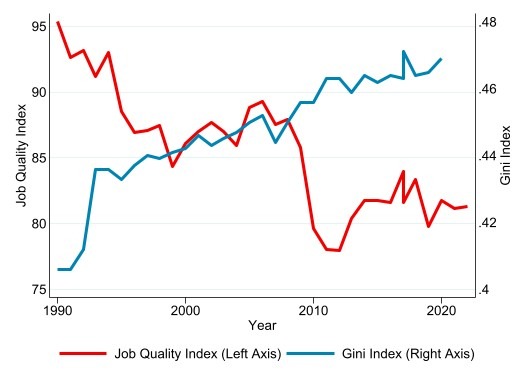
Source: U.S. Census Bureau and The Coalition for a Prosperous America
Inequality is a critical part of the story. This shift in wealth and boom of the U.S. financial sector has led to rising inequality in the U.S. that has been well documented by economists for decades.[13] [14] The high interest rates of past decades provided high returns and growth to the U.S. financial market. This process also moved capital towards financial markets. This pattern led to a shift towards larger firms that are more tied to international financial markets, downsizing/offshoring, higher unemployment and higher income inequality as firms cut costs.
Housing is less affordable in the U.S. than in the majority of OECD countries
Middle class households in the U.S. are less able to afford a home than households in most other OECD countries. Figure 3 below is the home price/income ratio for the 38 OECD member countries and the overall average (purple bar). This OECD index is the ratio of nominal house prices to household disposable income per capita. A higher index means homes are less affordable. The U.S. (136) has the 7th highest score, which is also 10 percentage points above the overall OECD average (126). Houses are more affordable in 31 other countries, despite the fact that the U.S. has higher incomes and more land per capita than most of them.
Figure 3: Home affordability U.S. vs other OECD Countries

Source: OECD Data, 2022 Q1
Conclusions
After decades of rising rapidly, house prices have now reached 6 times U.S. median household income. The growing unaffordability of housing for American families, especially young families, is an important driver for growing dissatisfaction with economic opportunity in the United States. Most recently, homes have become even more unaffordable as the COVID pandemic raised prices by 19%. The economic effects from COVID were even worse for women and minority workers. Overall, the growing un-affordability of houses in the U.S. reflects the stagnation of median household income and the artificial support of asset prices in the 21st century.
References
[1] Haoyang Liu, David Lucca, Dean Parker, and Gabriela Rays-Wahba, “The Housing Boom and the Decline in Mortgage Rates”, Federal Reserve Bank of New York, September 7, 2021
[2] Bernanke, Ben, Why Are Interest Rates So Low, part 3: The Global Savings Glut, April 1, 2015, Brookings Institution.
[3] U.S. Census Bureau, “Housing Vacancies and Homeownership”, CPA Calculations
[4] Jessica Lautz, “ Age of Buyers is Skyrocketing…But Not for Who You Might Think”, National Association of Realtors, January 13, 2020
[5] Using 2022 prices reflects the high 8.6% rate of inflation between 2022 and 2021. Using a different year with lower inflation would reduce the change in median income but it would overall still be low to negligent.
[6] “Tracking COVID-19 Unemployment and Job Losses”, Georgetown University, Accessed September 27, 2022
[7] Charles Hokayem, Ethan Krohn, And Matthew Unrath, “Fewer Low-Wage Full-Time, Year-Round Workers During COVID-19 Causes Increase in Median Earnings Among Those Still Employed”, U.S. Census Bureau, September 14, 2021
[8] Stefania Albanesi and Jiyeon Kim. “Effects of the COVID-19 Recession on the US Labor Market: Occupation, Family, and Gender”, Journal of Economic Perspectives, Vol.35 No.3 Summer 2021
[9] Nicholas Jones, Rachel Marks, Roberto Ramirez, Merarys Ríos-Vargas, “2020 Census Illuminates Racial and Ethnic Composition of the Country”, U.S. Census Bureau
[10] Latoya Hill and Samantha Artiga, “COVID-19 Cases and Deaths by Race/Ethnicity: Current Data and Changes Over Time”, Kaiser Family Foundation, August 22, 2022
[11] Jeff Ferry and Amanda Mayoral, “Quantifying Job Quality for U.S. Black, Hispanic, and Asian American Workers”, Coalition for a Prosperous America, May 21, 2021
[12] https://ubwp.buffalo.edu/job-quality-index-jqi/
[13] Bradford M. Van Arnum and Michele I. Naples, “Financialization and Income Inequality in the United States, 1967–2010”, The American Journal of Economics and Sociology, October 18, 2013
[14] Ken-Hou Lin and Donald Tomaskovic-Devey, “Financialization and U.S. Income Inequality, 1970–2008”, American Journal of Sociology, Vol 118, No.5


