By Jeff Ferry and Steven L Byers
When the Trump administration implemented tariffs on steel and aluminum in March 2018, many economists predicted job losses and consumer price hikes.
Their predictions relied, in part, on economic models which forecasted job losses of 200,000 or more from the tariffs. Yet the US economy is creating jobs at a rate of around 200,000 new jobs each month, and consumers are not experiencing price inflation. What’s going on?
Mainstream economics usually argues that tariffs will reduce employment, raise consumer prices and reduce economic growth. Mainstream economic models incorporate those beliefs through statistical relationships between key economic variables. But there have been few real world tests of those assumptions because tariffs in major economies like the US generally go down, not up.
CPA saw an opportunity to improve economic modeling by examining what is currently happening in the US economy. Specifically, we dove deeply into the internal workings of a standard trade model to compare its results with actual economic data that has been generated since the onset of tariffs. By doing so, we have been able to make improvements and corrections where the standard statistical and economic relationships went wrong.
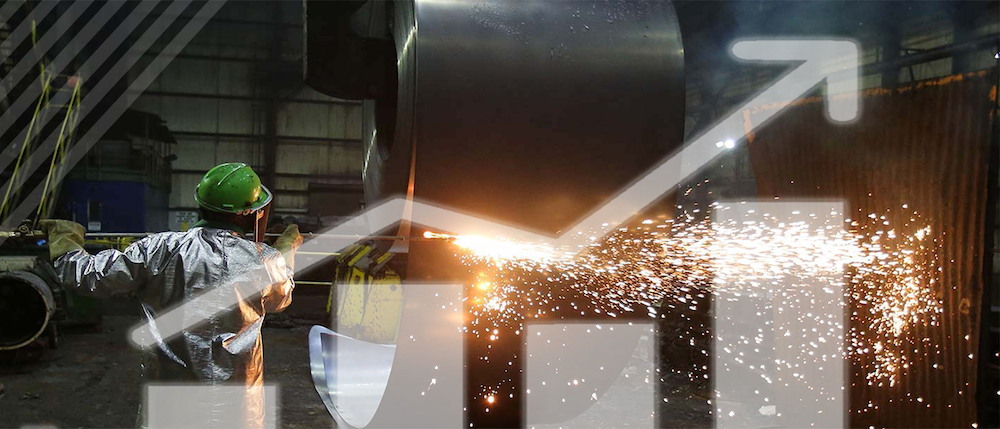
We modeled the impact of the 2018 steel tariffs using a commercially available macroeconomic model. Our results show an increase of 2.1 million additional jobs in 2018 over the baseline forecast, with smaller increases averaging 1.2 million additional jobs per year in the years 2019 through 2021. In an economy with just over 149 million jobs today, these are small but significant increases in employment. There were also small but significant increases in real gross domestic product (GDP) in our model.
Other trade models typically measure the macroeconomic impact of a tariff using a “ceteris paribus” assumption, in other words assuming nothing else changes in the economy. That’s a very unrealistic assumption. Our approach is different in that we utilize a multi-step approach to the forecast. First, we update the model to reflect economic conditions (GDP and employment) as of year-end 2017, then incorporate updated forecasts of GDP and employment using the most recent Congressional Budget Office assumptions. Next, we adjust prices in the model to reflect actual inflation for 75 consumption categories. Then we incorporate steel manufacturers’ reactions to the tariffs, which include investments in new and expanded capacity and new steel jobs.
Our key finding was that the set of economic policies implemented in 2017 and 2018 has caused the increase in jobs and GDP, which should continue for the next four years. The three most notable features of these policies are the tariffs, the tax cut (and associated increase in the federal budget deficit) and deregulation. The tariffs contributed to economic growth through increased investment in the affected industries and through helping to engender an atmosphere of business confidence, which stimulated investment and hiring in manufacturing industries. We chose to model the steel tariff first because steel is widely used in many manufacturing sectors and therefore the positive effects of recovery in steel influence business confidence in a broad swathe of manufacturing industries. While steel prices have risen significantly, those price increases have been absorbed by the steel-using industries with minimal effect on demand and profitability. Indeed, in most cases profitability has risen in manufacturing industry this year, as measured by the published quarterly results.
The most recent data we have on manufacturing output comes from the Federal Reserve’s Nov. 16thIndustrial Production report. This shows that manufacturing output was up 2.7 percent in October on a year-to-year basis. But the growth was heavily weighted towards the more capital-intensive (and higher-wage) durable manufacturing sector, where growth was 4.3 percent. Growth in machinery output was 6.9 percent and in aerospace 4.0 percent. Even in motor vehicles, a sector that is struggling with a structural mismatch between the vehicles consumers want to buy and the vehicles the companies produce, growth was still a reasonable 2.1 percent.
The steel tariff has triggered investment in steel production worth some $3.0 billion (not accounted for in most trade models), which steel corporate management expects to spend over the next three years. This also includes some 3,300 new steel jobs, with secondary job effects to follow in those regions and in related industries. Economic models do a poor job of identifying and forecasting industry-specific investment trends because they tend to be based on general macroeconomic principles that make national investment dependent on national savings. In most economic models, investment depends on savings. But in the real world, investment depends on expected future profit, which depends on expected business trends.
We also had to modify the price forecasts in the commercial version of the model. For example, based on our estimate of an average 12.5 percent price rise in steel prices this year, the unmodified model generated a 2 percent increase in new car prices. Yet BLS data for October shows that new car prices are up just 0.5 percent on a year-on-year basis, and comments from major car companies do not suggest any impending increase in car prices. We modified not just auto prices, but the prices of 75 major categories of consumer spending to make the price increases in 2018 mirror the actual price increases as reported by the BLS in its October report. It should be noted that for many years, the prices of manufactured goods have risen more slowly than services prices, and recent BLS data shows that trend continuing. (Oil and other commodities follow their own more volatile price trends.)
Our adjustments make the CPA model more realistic than other trade models. Price is a key area of concern. Other economic models typically assign great importance to price effects, i.e. rising prices cause sharp declines in demand and falling prices increases in demand. These effects are magnified by assumptions that most price changes are passed through down the supply chain to hit the consumer. This sounds reasonable on its own. Yet in the real world, price changes and associated demand effects can take place gradually over years and they are often counteracted by opposing forces. Other models typically “telescope” the long run effects of economic changes into the period immediately after the policy change.
The oligopoly structure of many industries often lead to price changes either not being passed on at all or being only partially passed on (as we are seeing today in the US auto industry). Secondly, income effects counteract the demand effects of price. In other words, higher profits, wages and revenues lead to greater spending on goods and services, even when prices rise. Those income effects are often magnified by expectations effects, in other words consumers and producers make spending decisions today based not only on the outlook for the next 12 months but on whether they expect that outlook to continue.
In conclusion, our model shows that the steel tariff, in the context of the US economy of 2018, has led to millions more jobs and GDP some half a percentage point higher this year than would otherwise have been the case. We have shown that it is possible to explain the difference between the current outcome of the US economy and the published forecasts of other trade models with a few key adjustments to a standard model.
For further detail, read our White Paper here.