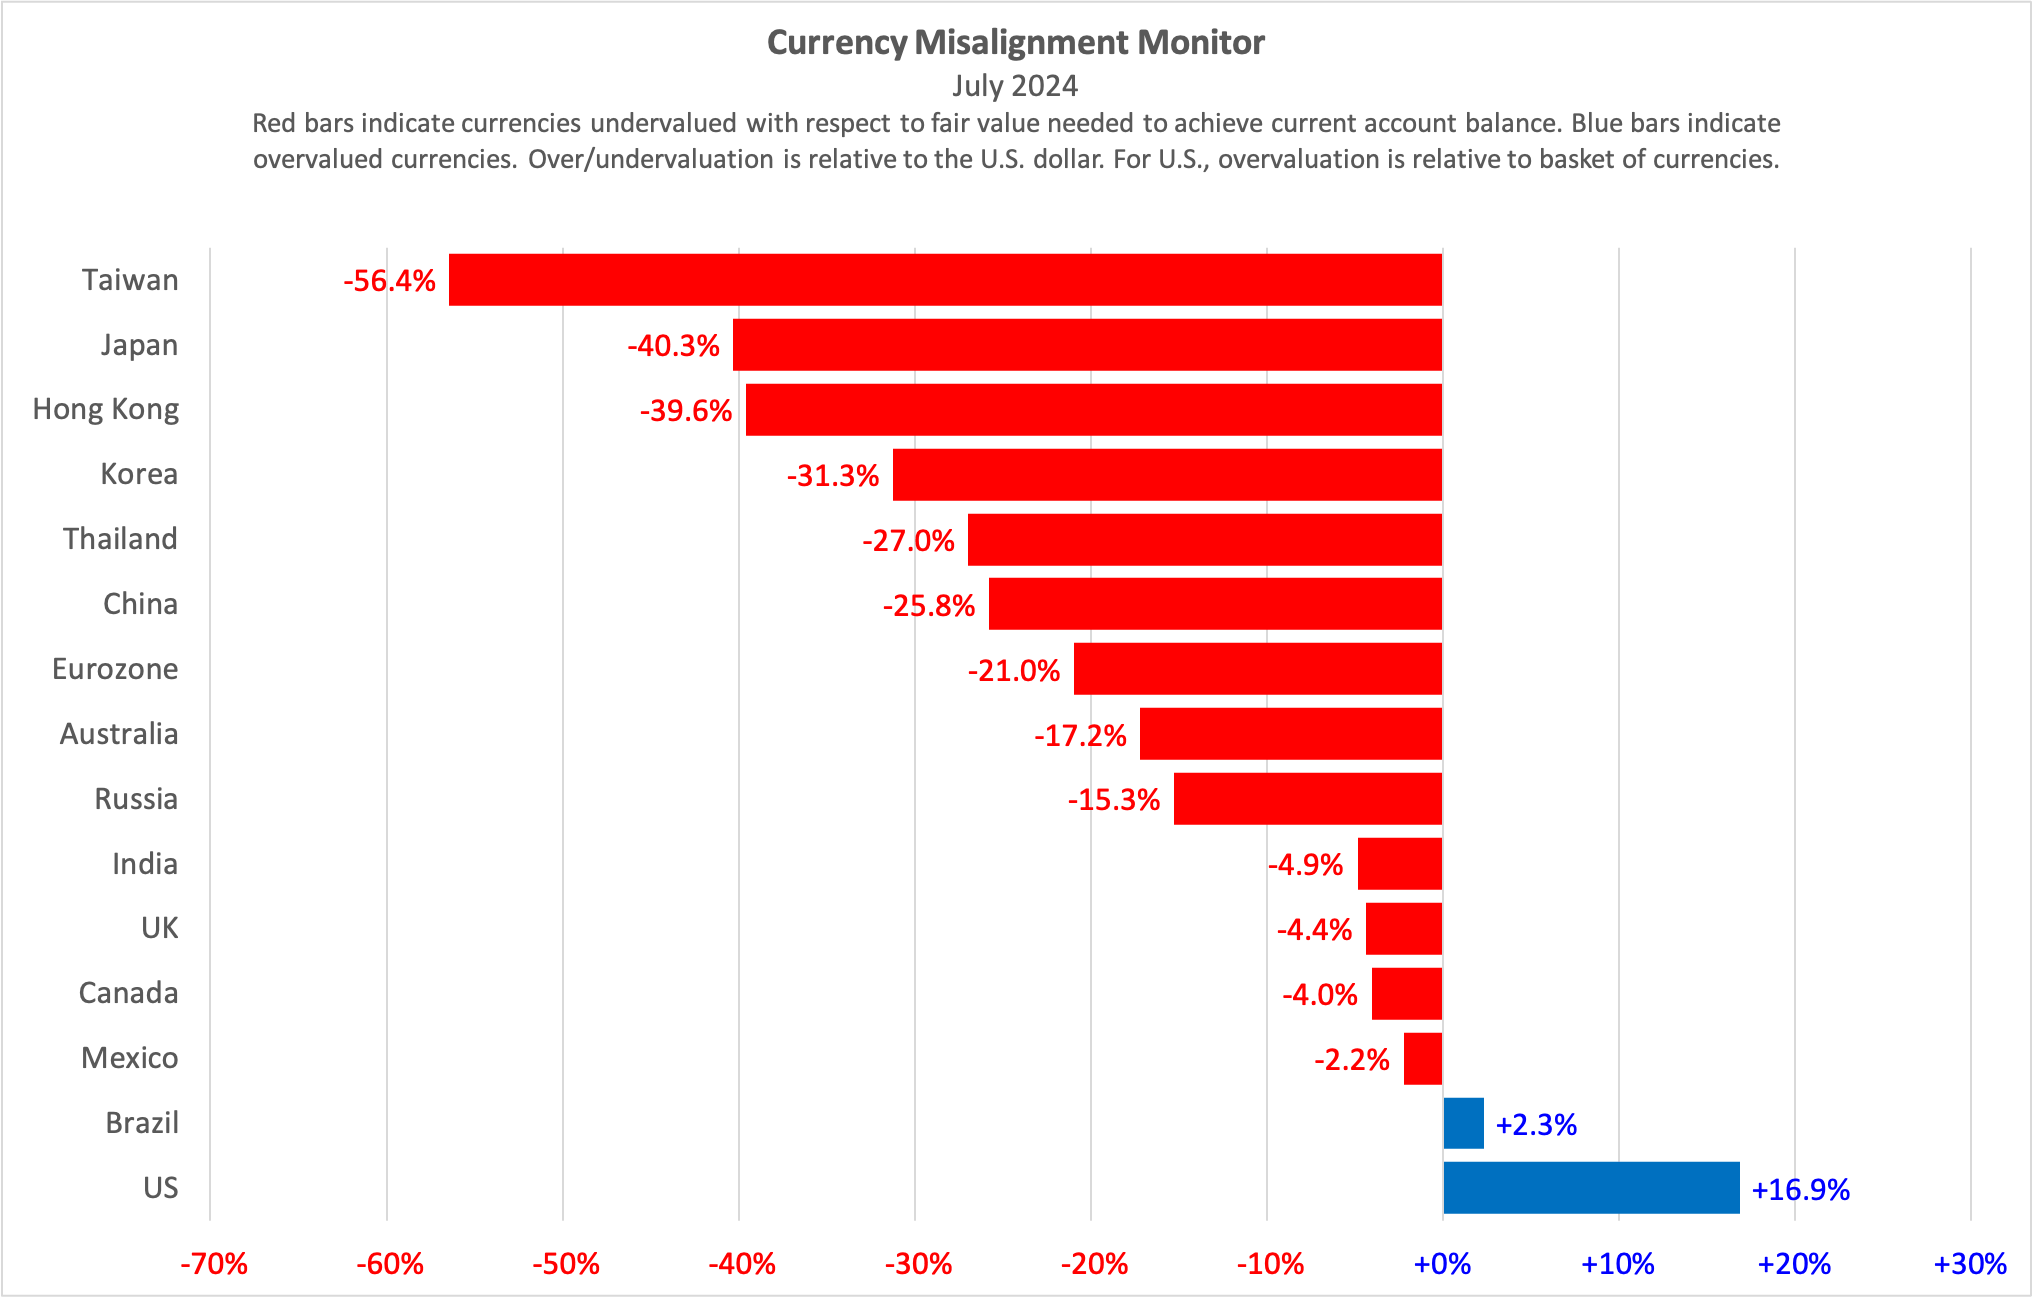
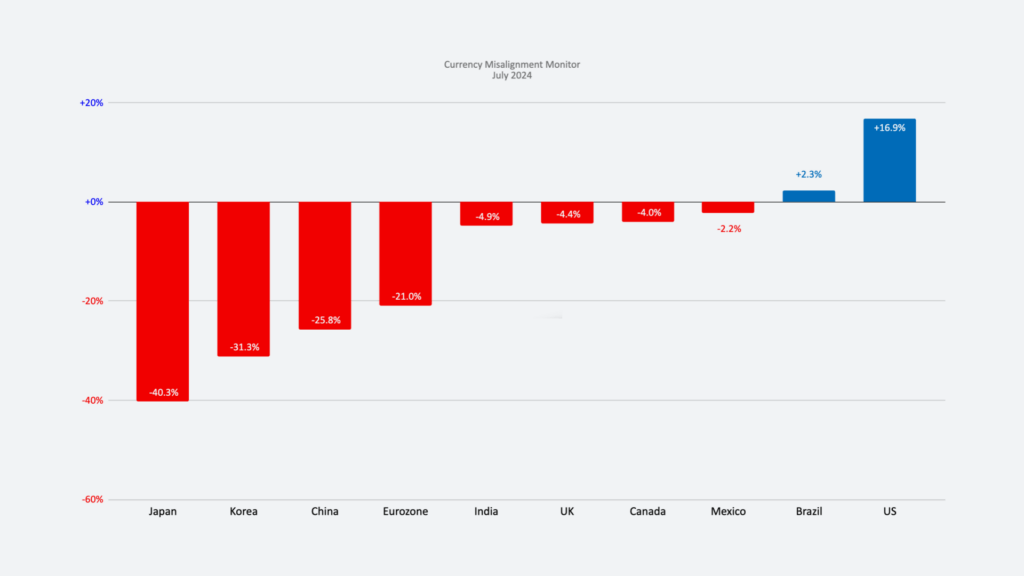
- The quarterly CPA Monitor tracks currency misalignment based on latest monthly exchange rates.
- Dollar overvaluation worsened to 16.9%, as hope of U.S. interest rate cuts was pushed out, prompting international investors to buy more dollar assets and profit from higher U.S. interest rates.
- Both the Chinese and Japanese currencies declined further in the last three months, leaving them 25.8% and 40.3% undervalued, respectively.
- The euro is 21% undervalued based on the latest published monthly exchange rates, which are for May. In recent weeks, the euro has shown further weakness, as European elections reveal division and disunity in the European Union.
The U.S. dollar continues grossly overvalued, creating a double-digit headwind for U.S. producers selling against imports at home or trying to succeed in global export markets. The U.S. dollar has risen steadily against a basket of other currencies, reaching a value that is 45% above its value in 2011 (see graph here). That’s despite the fact that the U.S. has run trade and current account deficits in every one of those years, which in standard economic theory implies the dollar ought to have been falling, not rising, throughout this period.
The CPA Currency Misalignment Monitor uses a sophisticated mathematical model to determine a set of currency values that would eliminate all trade surpluses and deficits among major nations over the next five years. We use data from respected international institutions, the International Monetary Fund and the Bank for International Settlements.
Our Monitor for July shows that the dollar is 16.9% overvalued. That figure is based on all currencies adjusting simultaneously to move the world to balance. (If the U.S. dollar had to move on its own to put the U.S. into trade balance, the adjustment needed would likely be on the order of 25%.)
Asian currencies benefit from huge levels of undervaluation against the dollar. Both China and Japan have allowed their currencies to edge downwards to support economic growth in their domestic economies. Japan’s undervaluation is especially large, with the yen at 156 to the dollar, compared to an equilibrium value of 111 in our model. China’s currency continues to slide, reaching 7.23 to the dollar in May. That’s despite the fact that trade data for January through May this year shows that China is on track to record its third successive year of trade surpluses over $800 billion.
Table 1. Currency valuations from the Currency Misalignment Monitor, July 2024

Notes: 1. % Over/Undervaluation is for U.S. dollar’s Real Effective Exchange Rate as compared to the basket of currencies. For all other currencies, over/undervaluation refers to bilateral relationship to the dollar. Blue figures indicate overvaluation and red figures indicate undervaluation. | |||||
2. FEER-consistent rate shows bilateral dollar exchange rate after each currency has moved to its Fundamental Equilibrium Exchange Rate. | |||||
3. Pound and Euro rates are expressed as dollars per those currencies. All others are currency per dollar. |
The CMM is based on a mathematical model in which 34 major currencies all move simultaneously to bring global current accounts into balance over a five-year time horizon. If the dollar had to move on its own, the dollar would need to move by approximately twice as much, or around 25%, to achieve fair value for the U.S. economy, i.e., a value that eliminated the current account deficit. The current account deficit is dominated by the trade deficit, but also includes some other financial flows into and out of the U.S.

METHODOLOGY
The Currency Misalignment Monitor is based on pioneering work done by William Cline at the Peterson Institute for International Economics. The Cline model, also known as SMIM for Symmetric Matrix Inversion Method, uses IMF forecasts for current account balances for 34 nations to derive a simultaneous solution for all exchange rates that will minimize national current account balances, including surpluses and deficits. The CMM uses this methodology. However, the Cline version sets a target of plus or minus 3% of GDP for each nation’s current account. We believe this is too flexible for a properly functioning global trading system. Our model sets a target of 0% current account balance for each nation. Most nations do not achieve 0% in year five, but the model seeks to get them as close to zero as possible and in so doing gives us a realistic sense of each currency’s over or undervaluation.
Note also that this methodology is dependent on IMF forecasts, which currently run from 2024 data out to 2029. The IMF has a history of optimism, including for example expectations that the U.S. current account deficit and the China surplus will both contract over time. If those forecasts turn out to be over-optimistic, then the misalignment estimates in the Monitor could well be understated. Nevertheless the Cline SMIM model is an innovative method for incorporating a large amount of global data into a single model.


