[vc_row][vc_column][vc_column_text]Economic theory tells us that national economies are supposed to trend over time towards balance, i.e.current account balances at or near zero. The graphs below show persistent imbalances for many nations, not just over years but decades, arguing that the current international monetary and trade systems are not fulfilling their objectives and need substantial modification.
[/vc_column_text][vc_empty_space][vc_column_text]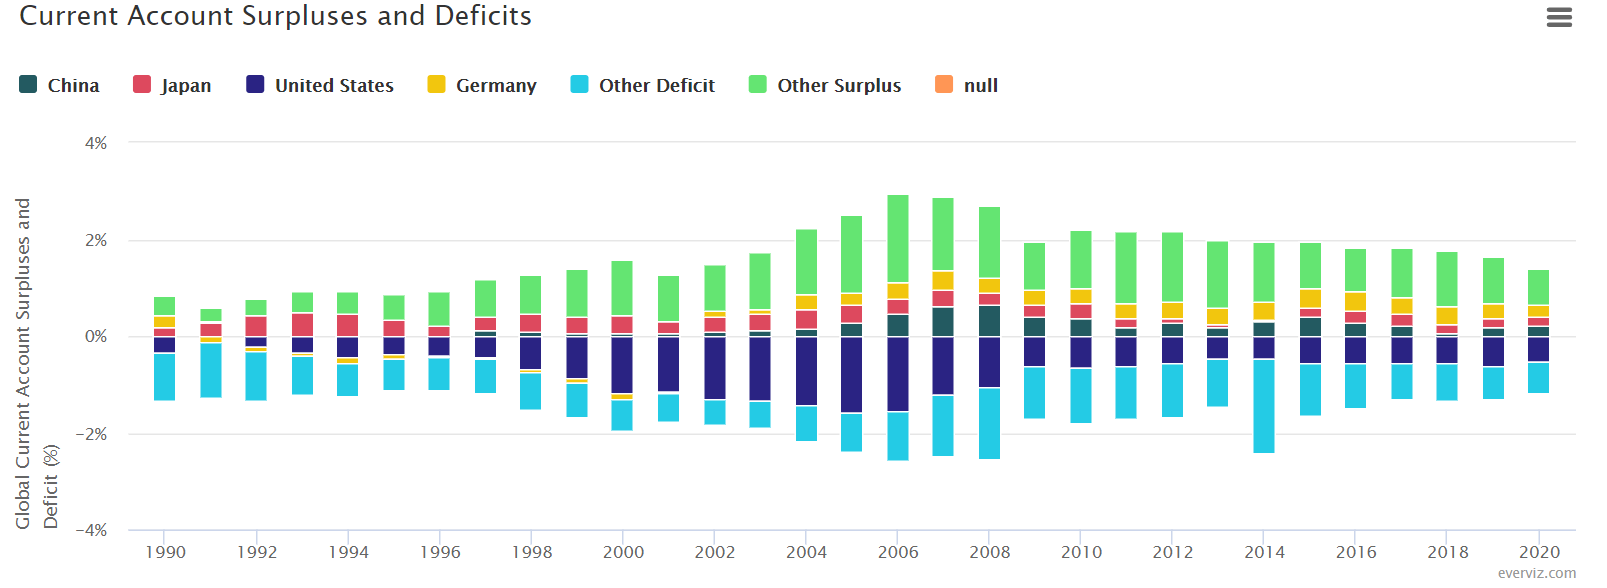 [/vc_column_text][vc_empty_space][vc_column_text]China, Japan, Germany and other countries have economic strategies to run persistent current account surpluses. The US is the primary country absorbing those surpluses, resulting in a trade deficit, lower growth and degradation of the quality of employment.[/vc_column_text][vc_empty_space][/vc_column][/vc_row][vc_row][vc_column width=”1/3″][vc_column_text]
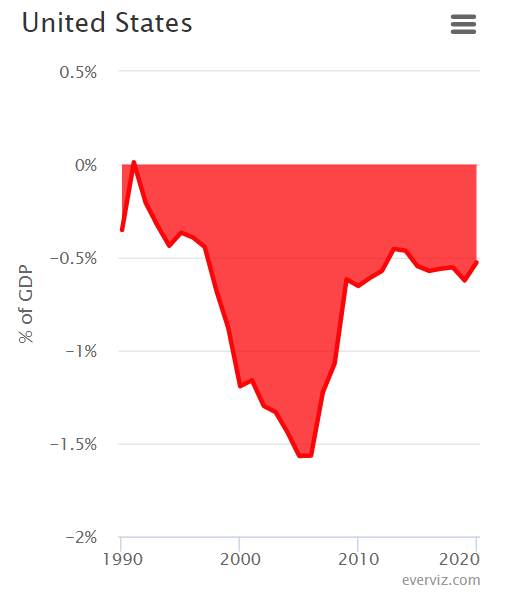 [/vc_column_text][vc_column_text]The US has been in persistent deficit on its current account for 27 years.[/vc_column_text][vc_empty_space height=”40px”][/vc_column][vc_column width=”1/3″][vc_column_text]
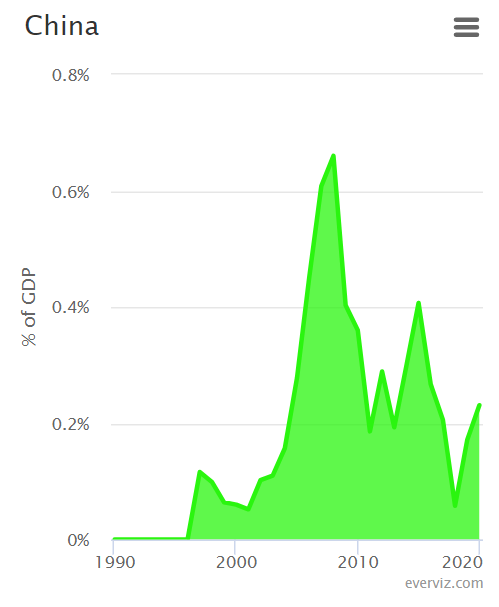 [/vc_column_text][vc_column_text]China has run a large, persistent current account surplus since its economic reforms in the 1990s aimed at accelerating growth and exports.[/vc_column_text][vc_empty_space height=”40px”][/vc_column][vc_column width=”1/3″][vc_column_text]
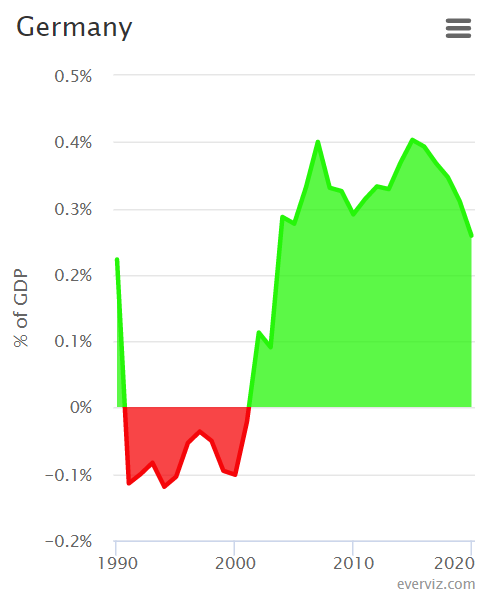 [/vc_column_text][vc_column_text]Germany runs the largest current account surplus of any major national economy, a reflection of the imbalance inherent in the euro, a single currency for 19 nations with very divergent[/vc_column_text][vc_empty_space height=”40px”][/vc_column][/vc_row][vc_row][vc_column width=”1/3″][vc_column_text]
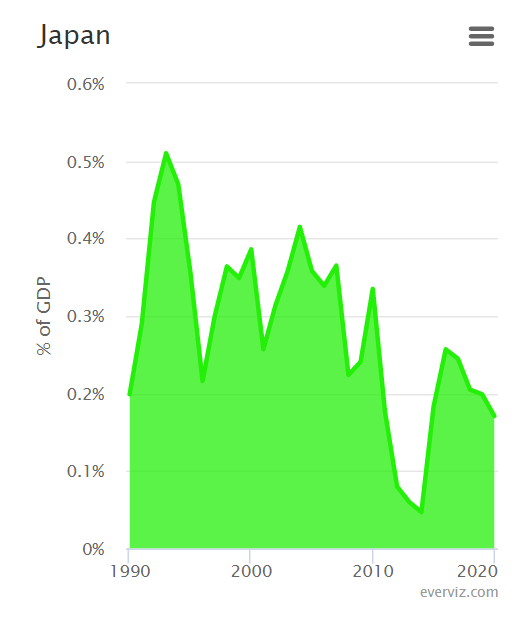 [/vc_column_text][vc_column_text]Japan runs a persistent current account surplus. Japan is credited with pioneering the so-called “Asian Tiger” strategy of running export surpluses as a means towards rapid economic growth.[/vc_column_text][vc_empty_space height=”40px”][/vc_column][/vc_row][vc_row][vc_column][vc_column_text]
Source: International Monetary Fund
[/vc_column_text][/vc_column][/vc_row][vc_row][vc_column][vc_column_text]
[/vc_column_text][/vc_column][/vc_row][vc_row][vc_column width=”1/3″][dt_icon_text layout=”layout_1″ show_link=”y” link=”url:https%3A%2F%2Fprosperousamerica.org%2Fcpa-trade-database%2Fus-monthly-trade-data-2%2F|title:US%20Monthly%20Trade%20Data” apply_link=”block” dt_text_title=”US Monthly Trade Data” heading_tag=”h3″ dt_text_title_font_size=”24px” dt_text_title_bottom_margin=”15px” dt_text_desc=”A look at the latest monthly data for us trade balance, exports and imports” dt_text_content_font_size=”18px” dt_text_content_line_height=”21px” show_btn=”n” icon_picker=”fas fa-chart-line” dt_text_icon_size=”20px” dt_text_icon_bg_size=”50px” dt_text_icon_border_width=”2px” dt_text_icon_paddings=”0px 10px 10px 0px” dt_text_icon_color=”#ffffff”][vc_empty_space][/vc_column][vc_column width=”1/3″][dt_icon_text layout=”layout_1″ show_link=”y” link=”url:https%3A%2F%2Fprosperousamerica.org%2Fcpa-trade-database%2Fus-trade-balance-by-major-sectors%2F|title:US%20Monthly%20Trade%20Data” apply_link=”block” dt_text_title=”US Annual Trade Balance” heading_tag=”h3″ dt_text_title_font_size=”24px” dt_text_title_bottom_margin=”15px” dt_text_desc=”US trade balance history including key sub-sectors” dt_text_content_font_size=”18px” dt_text_content_line_height=”21px” show_btn=”n” icon_picker=”fas fa-arrows-alt-h” dt_text_icon_size=”20px” dt_text_icon_bg_size=”50px” dt_text_icon_border_width=”2px” dt_text_icon_paddings=”0px 10px 10px 0px” dt_text_icon_color=”#ffffff”][vc_empty_space][/vc_column][vc_column width=”1/3″][dt_icon_text layout=”layout_1″ show_link=”y” link=”url:https%3A%2F%2Fprosperousamerica.org%2Fcpa-trade-database%2Fus-bilateral-trade-balances-2019-goods-trade%2F|title:US%20Monthly%20Trade%20Data” apply_link=”block” dt_text_title=”US Bilateral Trade” heading_tag=”h3″ dt_text_title_font_size=”24px” dt_text_title_bottom_margin=”15px” dt_text_desc=”Our trade with other nations showing major surpluses and deficits” dt_text_content_font_size=”18px” dt_text_content_line_height=”21px” show_btn=”n” icon_picker=”fas fa-globe-americas” dt_text_icon_size=”20px” dt_text_icon_bg_size=”50px” dt_text_icon_border_width=”2px” dt_text_icon_paddings=”0px 10px 10px 0px” dt_text_icon_color=”#ffffff”][vc_empty_space][/vc_column][/vc_row][vc_row][vc_column width=”1/3″][dt_icon_text layout=”layout_1″ show_link=”y” link=”url:https%3A%2F%2Fprosperousamerica.org%2Fcpa-trade-database%2Fus-advanced-technology-trade-and-sub-sectors%2F|title:US%20Monthly%20Trade%20Data” apply_link=”block” dt_text_title=”US Advanced Technology” heading_tag=”h3″ dt_text_title_font_size=”24px” dt_text_title_bottom_margin=”15px” dt_text_desc=”Our trade in Advanced Technology products and key sub-sectors of Advanced Technology” dt_text_content_font_size=”18px” dt_text_content_line_height=”21px” show_btn=”n” icon_picker=”fas fa-file-invoice” dt_text_icon_size=”20px” dt_text_icon_bg_size=”50px” dt_text_icon_border_width=”2px” dt_text_icon_paddings=”0px 10px 10px 0px” dt_text_icon_color=”#ffffff”][vc_empty_space][/vc_column][vc_column width=”1/3″][dt_icon_text layout=”layout_1″ show_link=”y” link=”url:https%3A%2F%2Fprosperousamerica.org%2Fcpa-trade-database%2Fglobal-imbalances-current-account-balances-as-share-of-gdp%2F|title:US%20Monthly%20Trade%20Data” apply_link=”block” dt_text_title=”Global Imbalances” heading_tag=”h3″ dt_text_title_font_size=”24px” dt_text_title_bottom_margin=”15px” dt_text_desc=”Current account balance as a percent of GDP for the US and other major nations” dt_text_content_font_size=”18px” dt_text_content_line_height=”21px” show_btn=”n” icon_picker=”fas fa-balance-scale” dt_text_icon_size=”20px” dt_text_icon_bg_size=”50px” dt_text_icon_border_width=”2px” dt_text_icon_paddings=”0px 10px 10px 0px” dt_text_icon_color=”#ffffff”][vc_empty_space][/vc_column][vc_column width=”1/3″][dt_icon_text layout=”layout_1″ show_link=”y” link=”url:https%3A%2F%2Fprosperousamerica.org%2Fcpa-trade-database%2Fexchange-rates-major-international-currencies%2F|title:US%20Monthly%20Trade%20Data” apply_link=”block” dt_text_title=”Exchange Rates” heading_tag=”h3″ dt_text_title_font_size=”24px” dt_text_title_bottom_margin=”15px” dt_text_desc=”Exchange rates for the US dollar and other major currencies” dt_text_content_font_size=”18px” dt_text_content_line_height=”21px” show_btn=”n” icon_picker=”fas fa-money-bill” dt_text_icon_size=”20px” dt_text_icon_bg_size=”50px” dt_text_icon_border_width=”2px” dt_text_icon_paddings=”0px 10px 10px 0px” dt_text_icon_color=”#ffffff”][vc_empty_space][/vc_column][/vc_row]


